
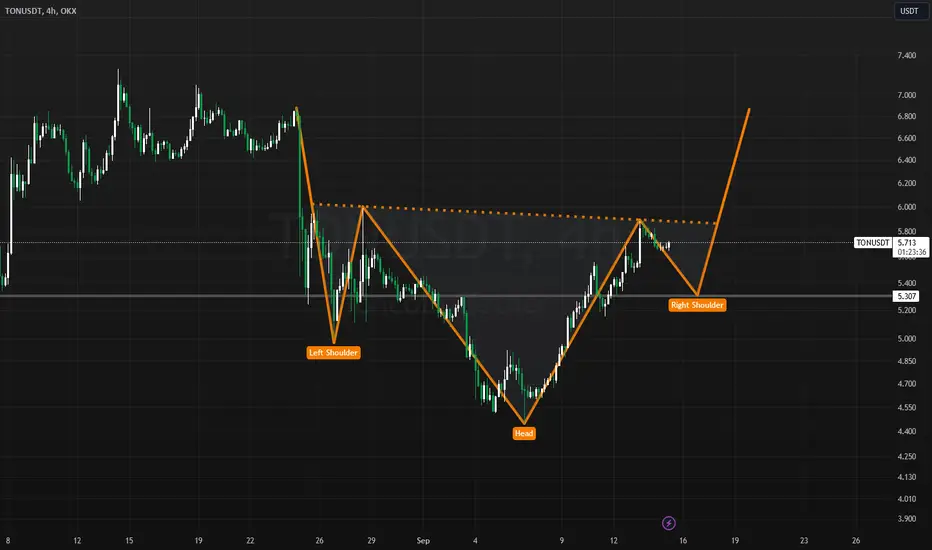
In the latest technical analysis, a bullish "Inverse Head and Shoulders" pattern has appeared. The price started at $6.8, dropping to $5 to form the left shoulder. It then rebounded to $6 before falling to a low of $4.4, marking the head. From there, the price surged back to $5.9, creating the right shoulder.
This pattern is often a strong indicator of a potential bullish reversal, signaling a possible upward move. Traders are now eagerly watching for a breakout above resistance levels, which could confirm the continuation of the uptrend. Will this be the beginning of a new rally?
The next price movement could set the stage for the market's short-term bullish momentum.
This pattern is often a strong indicator of a potential bullish reversal, signaling a possible upward move. Traders are now eagerly watching for a breakout above resistance levels, which could confirm the continuation of the uptrend. Will this be the beginning of a new rally?
The next price movement could set the stage for the market's short-term bullish momentum.

כתב ויתור
המידע והפרסומים אינם מיועדים להיות, ואינם מהווים, ייעוץ או המלצה פיננסית, השקעתית, מסחרית או מכל סוג אחר המסופקת או מאושרת על ידי TradingView. קרא עוד ב־תנאי השימוש.
כתב ויתור
המידע והפרסומים אינם מיועדים להיות, ואינם מהווים, ייעוץ או המלצה פיננסית, השקעתית, מסחרית או מכל סוג אחר המסופקת או מאושרת על ידי TradingView. קרא עוד ב־תנאי השימוש.