
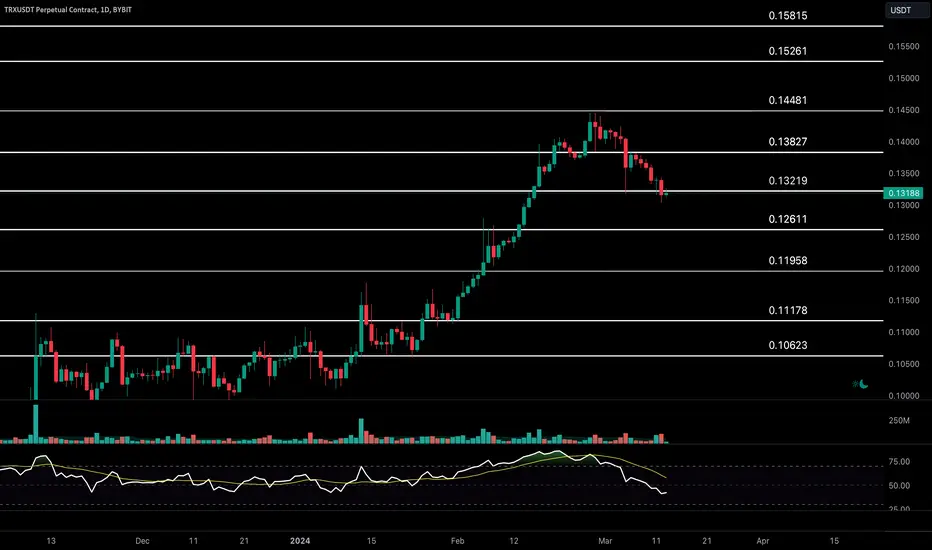
Tron is having a bearish pullback and trading in the daily range zone where we will continue to see a slow and choppy price action.
A bullish reversal from the current price location reclaiming $0.132 will result in a slow upward move to $0.138.
A confirmation of a break-out of $0.132 will push TRX price towards $0.126.
Intraday Chart

The TRXUSDT 4-Hour chart is bearish and re-testing $0.132, an intraday resistance.
A bearish rejection of $0.132 will result in a bearish dip of Tron price towards the key intraday support zone of $0.128-$0.13which, in turn, could lead to a strong bullish rejection of this support zone.
A bullish break-out of $0.132 will push price higher to $0.134.
Like once read!
Thank you.
A bullish reversal from the current price location reclaiming $0.132 will result in a slow upward move to $0.138.
A confirmation of a break-out of $0.132 will push TRX price towards $0.126.
Intraday Chart
The TRXUSDT 4-Hour chart is bearish and re-testing $0.132, an intraday resistance.
A bearish rejection of $0.132 will result in a bearish dip of Tron price towards the key intraday support zone of $0.128-$0.13which, in turn, could lead to a strong bullish rejection of this support zone.
A bullish break-out of $0.132 will push price higher to $0.134.
Like once read!
Thank you.

Check out the daily market updates on youtube.com/@TradeLeanCom
כתב ויתור
המידע והפרסומים אינם מיועדים להיות, ואינם מהווים, ייעוץ או המלצה פיננסית, השקעתית, מסחרית או מכל סוג אחר המסופקת או מאושרת על ידי TradingView. קרא עוד ב־תנאי השימוש.
Check out the daily market updates on youtube.com/@TradeLeanCom
כתב ויתור
המידע והפרסומים אינם מיועדים להיות, ואינם מהווים, ייעוץ או המלצה פיננסית, השקעתית, מסחרית או מכל סוג אחר המסופקת או מאושרת על ידי TradingView. קרא עוד ב־תנאי השימוש.