
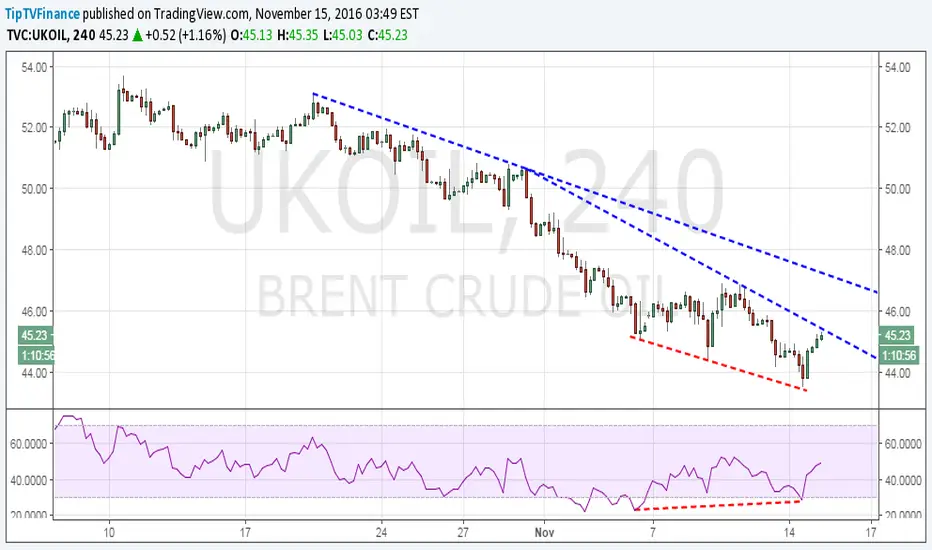
The 4-hour chart shows a bullish price RSI divergence followed by a rise to the descending trend line hurdle.
Oil bulls now await a breach of the trend line hurdle, following which the prices could rise to $46.90 (larger descending trend line hurdle)
On the other hand, a repeated failure to take out trend line hurdle would open doors for a revisit to a recent low of $43.55.
Oil bulls now await a breach of the trend line hurdle, following which the prices could rise to $46.90 (larger descending trend line hurdle)
On the other hand, a repeated failure to take out trend line hurdle would open doors for a revisit to a recent low of $43.55.

כתב ויתור
המידע והפרסומים אינם מיועדים להיות, ואינם מהווים, ייעוץ או המלצה פיננסית, השקעתית, מסחרית או מכל סוג אחר המסופקת או מאושרת על ידי TradingView. קרא עוד ב־תנאי השימוש.
כתב ויתור
המידע והפרסומים אינם מיועדים להיות, ואינם מהווים, ייעוץ או המלצה פיננסית, השקעתית, מסחרית או מכל סוג אחר המסופקת או מאושרת על ידי TradingView. קרא עוד ב־תנאי השימוש.