
Hello,
Traders
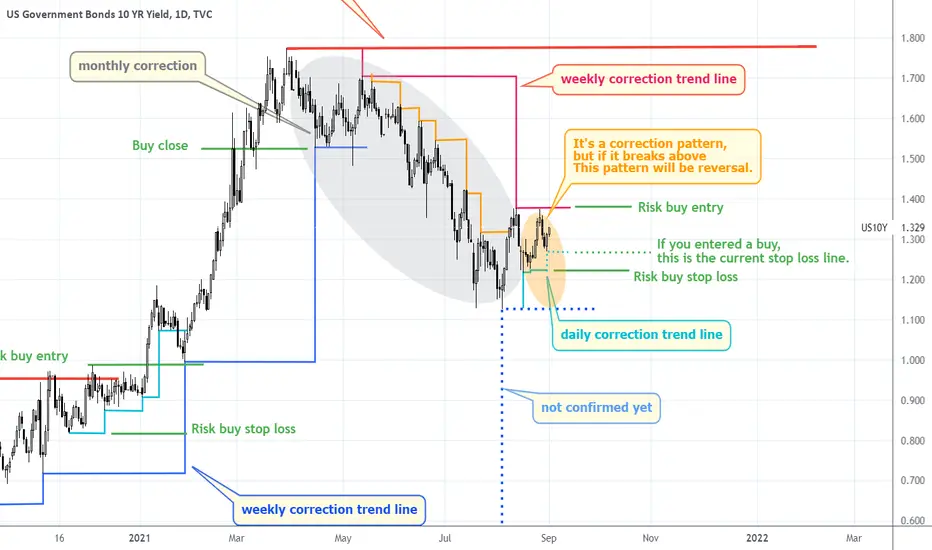
This is an update of the 10-year U.S. Treasury yield time wave analysis.
The daily correction trend line seems to be rising.
The signal for entry is still early.
If you enter a buy, put your stop loss below the last daily correction trend line.
A true reversal can be achieved only after breaking the weekly correction trend line of the downtrend. (The dotted line is the expected next daily correction trend line.)
However, since there is a large risk of stop loss, it seems that the correction trend line of the 4-hour chart can be used for entry and stop loss.
We will update again when there are changes.
good luck.
Traders
This is an update of the 10-year U.S. Treasury yield time wave analysis.
The daily correction trend line seems to be rising.
The signal for entry is still early.
If you enter a buy, put your stop loss below the last daily correction trend line.
A true reversal can be achieved only after breaking the weekly correction trend line of the downtrend. (The dotted line is the expected next daily correction trend line.)
However, since there is a large risk of stop loss, it seems that the correction trend line of the 4-hour chart can be used for entry and stop loss.
We will update again when there are changes.
good luck.

כתב ויתור
המידע והפרסומים אינם מיועדים להיות, ואינם מהווים, ייעוץ או המלצה פיננסית, השקעתית, מסחרית או מכל סוג אחר המסופקת או מאושרת על ידי TradingView. קרא עוד ב־תנאי השימוש.
כתב ויתור
המידע והפרסומים אינם מיועדים להיות, ואינם מהווים, ייעוץ או המלצה פיננסית, השקעתית, מסחרית או מכל סוג אחר המסופקת או מאושרת על ידי TradingView. קרא עוד ב־תנאי השימוש.