
📉 US30 Technical Analysis (1H Chart)
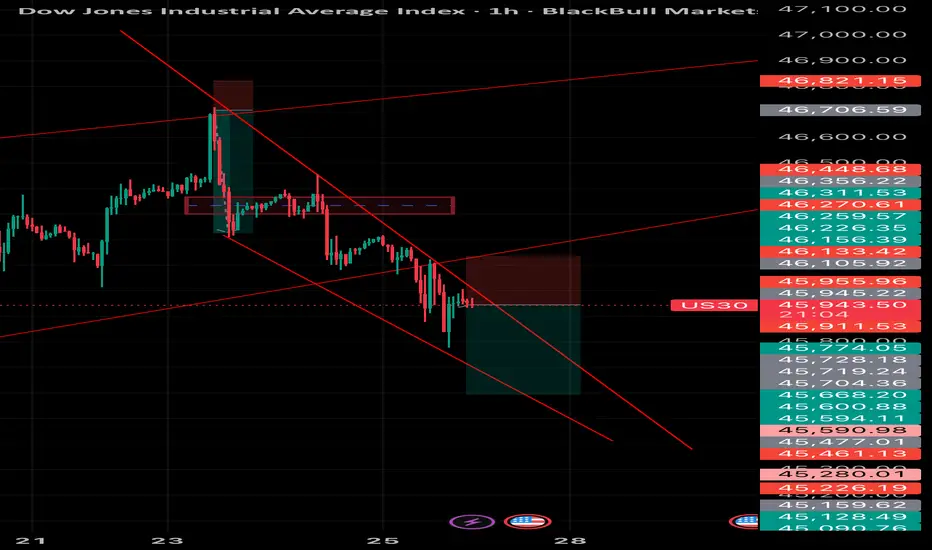
US30 is currently trading at 45,936 and remains inside a well-defined descending channel, showing strong bearish momentum.
• Trend: Price broke below the previous support (around 46,105 – 46,133) and retested it as resistance, confirming bearish continuation.
• Entry Zone: The rejection candle around the retest zone suggests sellers are still in control.
• Target Levels:
• First support: 45,911
• Next bearish target zone: 45,774 – 45,590 (lower channel support)
• Invalidation: A clean break and 1H close above 46,133 would invalidate the bearish setup and open room for bullish correction.
👉 Bias remains bearish as long as price stays under 46,100. Short-term downside continuation expected toward 45,700 – 45,600.
US30 is currently trading at 45,936 and remains inside a well-defined descending channel, showing strong bearish momentum.
• Trend: Price broke below the previous support (around 46,105 – 46,133) and retested it as resistance, confirming bearish continuation.
• Entry Zone: The rejection candle around the retest zone suggests sellers are still in control.
• Target Levels:
• First support: 45,911
• Next bearish target zone: 45,774 – 45,590 (lower channel support)
• Invalidation: A clean break and 1H close above 46,133 would invalidate the bearish setup and open room for bullish correction.
👉 Bias remains bearish as long as price stays under 46,100. Short-term downside continuation expected toward 45,700 – 45,600.

כתב ויתור
המידע והפרסומים אינם מיועדים להיות, ואינם מהווים, ייעוץ או המלצה פיננסית, השקעתית, מסחרית או מכל סוג אחר המסופקת או מאושרת על ידי TradingView. קרא עוד ב־תנאי השימוש.
כתב ויתור
המידע והפרסומים אינם מיועדים להיות, ואינם מהווים, ייעוץ או המלצה פיננסית, השקעתית, מסחרית או מכל סוג אחר המסופקת או מאושרת על ידי TradingView. קרא עוד ב־תנאי השימוש.