
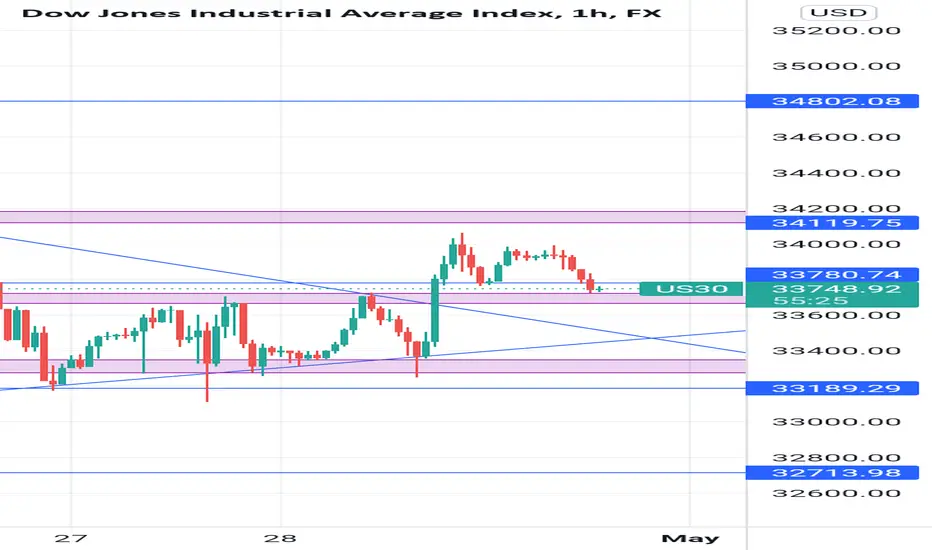
The charts shows three strong zones the first resistance and the two supports below which might later turn resistance currently after yesterday's double Bottom which broke out the market has currently formed a double top for a down trade but below the break of the neckline there is a strong support if price breaks below we might see a sell to the next support or the base of the symmetrical trnagle or price might test the first support and continue moving up to the first resistance of it breaks above the resistance it's a massive long position

כתב ויתור
המידע והפרסומים אינם מיועדים להיות, ואינם מהווים, ייעוץ או המלצה פיננסית, השקעתית, מסחרית או מכל סוג אחר המסופקת או מאושרת על ידי TradingView. קרא עוד ב־תנאי השימוש.
כתב ויתור
המידע והפרסומים אינם מיועדים להיות, ואינם מהווים, ייעוץ או המלצה פיננסית, השקעתית, מסחרית או מכל סוג אחר המסופקת או מאושרת על ידי TradingView. קרא עוד ב־תנאי השימוש.