Uncertain S&P 500
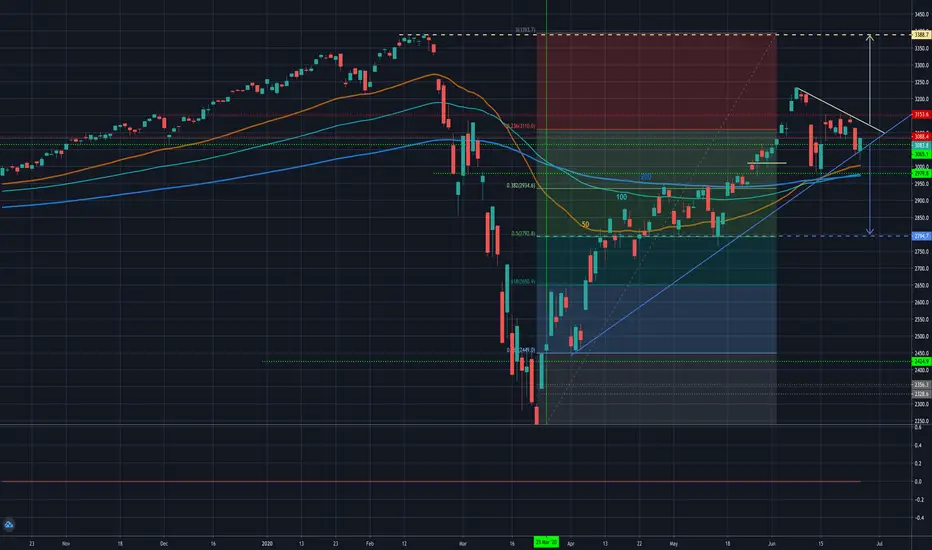
On my chart, you can see the triangle in which the price moves, the lower border of the triangle is indicated by blue colors and when it breaks down it can lead to a further drop in the price. And there is also the upper border of the triangle marked in yellow and when it is broken up, it will be a signal of further restoration of the market up to the previous maximum prices

כתב ויתור
המידע והפרסומים אינם מיועדים להיות, ואינם מהווים, ייעוץ או המלצה פיננסית, השקעתית, מסחרית או מכל סוג אחר המסופקת או מאושרת על ידי TradingView. קרא עוד ב־תנאי השימוש.
כתב ויתור
המידע והפרסומים אינם מיועדים להיות, ואינם מהווים, ייעוץ או המלצה פיננסית, השקעתית, מסחרית או מכל סוג אחר המסופקת או מאושרת על ידי TradingView. קרא עוד ב־תנאי השימוש.