Technically the 
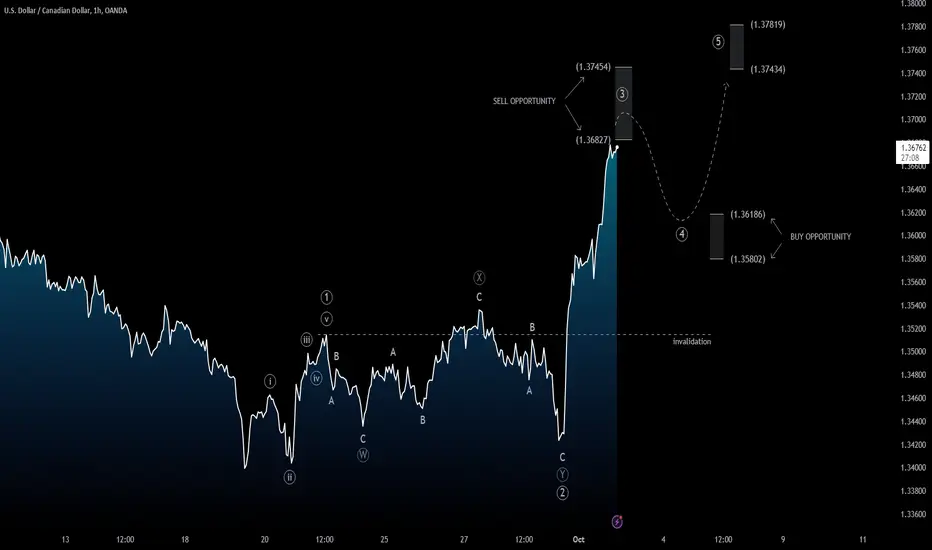
 USDCAD pair seems to follow 12345 bullish impulse structure on intraday chart. Having said this, it is possible to follow 2 setups (bearish and bullish) on levels shown on the chart. On the short side, it is good to monitor and manage the position closely and move stop loss to breakeven as soon as possible. In this case the expected pullback could take the form of ABC or ABCDE Pattern. Levels may change, so follow our updates below or on our website.
Trade with care
Like | Share | Comment
USDCAD pair seems to follow 12345 bullish impulse structure on intraday chart. Having said this, it is possible to follow 2 setups (bearish and bullish) on levels shown on the chart. On the short side, it is good to monitor and manage the position closely and move stop loss to breakeven as soon as possible. In this case the expected pullback could take the form of ABC or ABCDE Pattern. Levels may change, so follow our updates below or on our website.Trade with care
Like | Share | Comment
עסקה פעילה
🔴 Sell Areaהערה
📊 Resistance Area Approach:הערה

כתב ויתור
המידע והפרסומים אינם מיועדים להיות, ואינם מהווים, ייעוץ או המלצה פיננסית, השקעתית, מסחרית או מכל סוג אחר המסופקת או מאושרת על ידי TradingView. קרא עוד ב־תנאי השימוש.
כתב ויתור
המידע והפרסומים אינם מיועדים להיות, ואינם מהווים, ייעוץ או המלצה פיננסית, השקעתית, מסחרית או מכל סוג אחר המסופקת או מאושרת על ידי TradingView. קרא עוד ב־תנאי השימוש.