

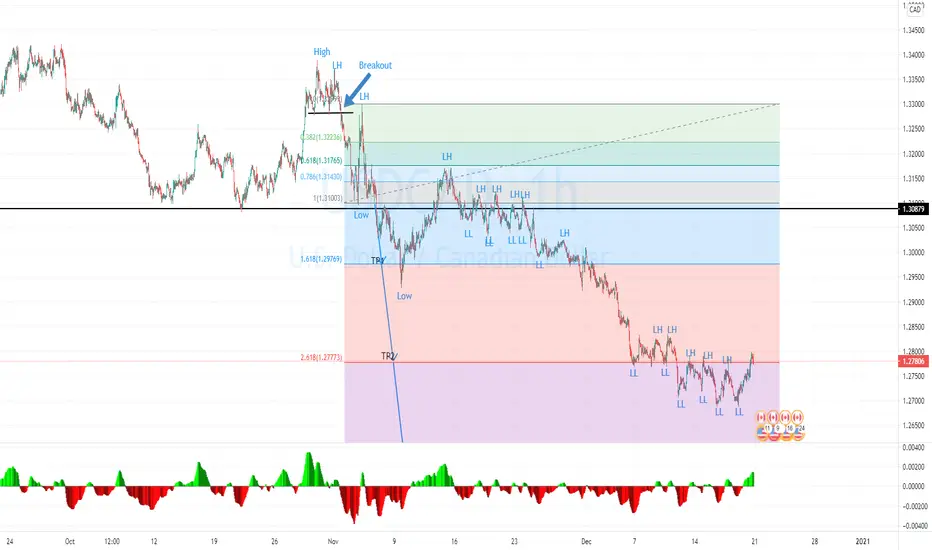
USDCAD on the 1H time-frame.
Steps:
1. The price still running downtrend by created the lower high and lower low.
2. The price already hit TP1: 1.29769 and TP2: 1.27773 at the Fibonacci level.
3. The next level is TP3: 1.25431 and 1.24546 at the support zone in Day time frame.
4. If the next MACD (-) create the higher low then there will be the 1st step of the reversal pattern.
Steps:
1. The price still running downtrend by created the lower high and lower low.
2. The price already hit TP1: 1.29769 and TP2: 1.27773 at the Fibonacci level.
3. The next level is TP3: 1.25431 and 1.24546 at the support zone in Day time frame.
4. If the next MACD (-) create the higher low then there will be the 1st step of the reversal pattern.

כתב ויתור
המידע והפרסומים אינם מיועדים להיות, ואינם מהווים, ייעוץ או המלצה פיננסית, השקעתית, מסחרית או מכל סוג אחר המסופקת או מאושרת על ידי TradingView. קרא עוד ב־תנאי השימוש.
כתב ויתור
המידע והפרסומים אינם מיועדים להיות, ואינם מהווים, ייעוץ או המלצה פיננסית, השקעתית, מסחרית או מכל סוג אחר המסופקת או מאושרת על ידי TradingView. קרא עוד ב־תנאי השימוש.