

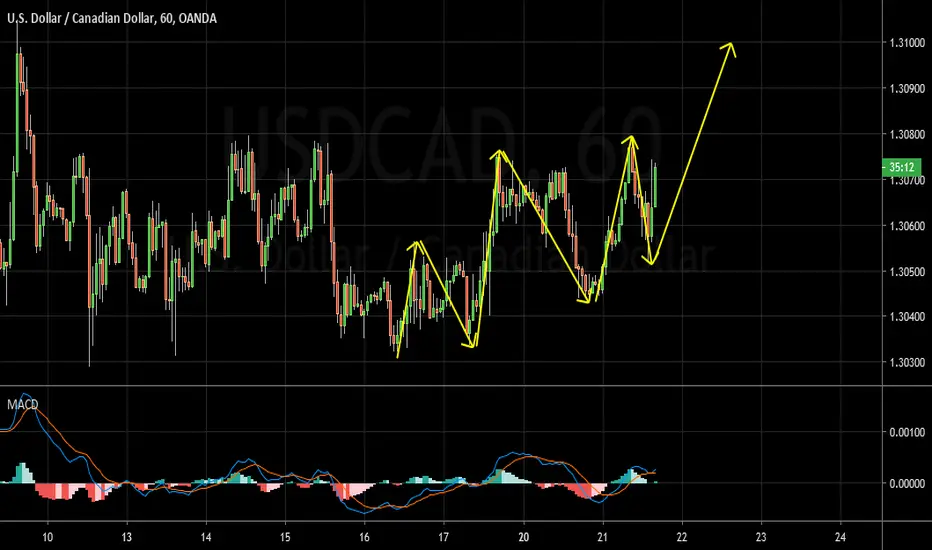
W1 - After a triple cycle, currently it looks like a retrace is happening in the form of a range pattern.
Price has reached the 38.2% - 50% fibonacci retracement zone.
H4 - Downtrend line breakout, looks like the pullback that we are looking for happened.
H1 - Bullish trend pattern, we may now look for bullish setups with more bullish evidences in order to join the buys.
Price has reached the 38.2% - 50% fibonacci retracement zone.
H4 - Downtrend line breakout, looks like the pullback that we are looking for happened.
H1 - Bullish trend pattern, we may now look for bullish setups with more bullish evidences in order to join the buys.

כתב ויתור
המידע והפרסומים אינם מיועדים להיות, ואינם מהווים, ייעוץ או המלצה פיננסית, השקעתית, מסחרית או מכל סוג אחר המסופקת או מאושרת על ידי TradingView. קרא עוד ב־תנאי השימוש.
כתב ויתור
המידע והפרסומים אינם מיועדים להיות, ואינם מהווים, ייעוץ או המלצה פיננסית, השקעתית, מסחרית או מכל סוג אחר המסופקת או מאושרת על ידי TradingView. קרא עוד ב־תנאי השימוש.