

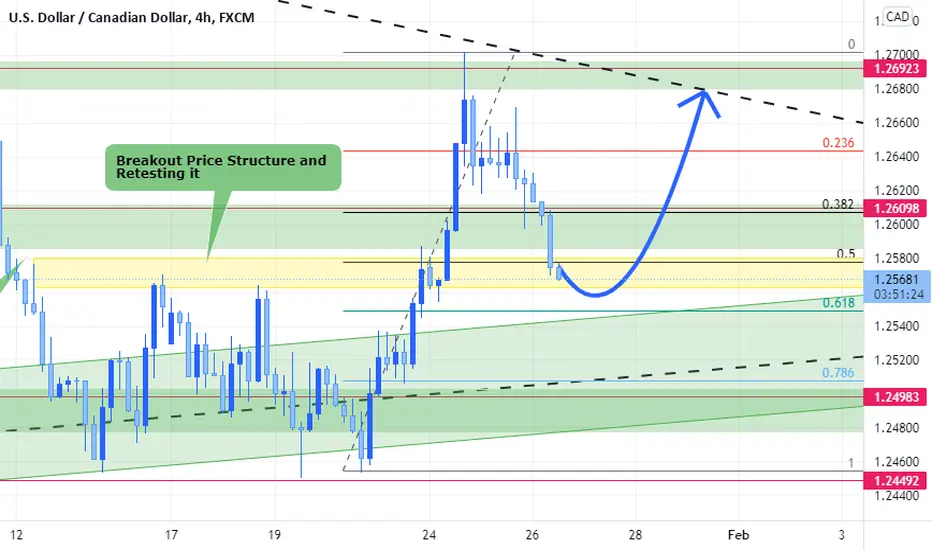
This pair is going bullish for now
Technical Analysis
1-Break out price structure and retesting it before continuation to the upside
2-Ascending Triangle Chart Pattern on weekly Time Frame
*Sentimental Analysis:
1-CADJPY Reached falling resistance level indicating bearish move for the pair (Indicating possible weakness for the CAD)

2-AUDCAD is making Q&M chart Pattern which is indication of bullish move for the pair(Indicating possible weakness for the CAD)

Technical Analysis
1-Break out price structure and retesting it before continuation to the upside
2-Ascending Triangle Chart Pattern on weekly Time Frame
*Sentimental Analysis:
1-CADJPY Reached falling resistance level indicating bearish move for the pair (Indicating possible weakness for the CAD)
2-AUDCAD is making Q&M chart Pattern which is indication of bullish move for the pair(Indicating possible weakness for the CAD)
עסקה סגורה: היעד הושג

כתב ויתור
המידע והפרסומים אינם מיועדים להיות, ואינם מהווים, ייעוץ או המלצה פיננסית, השקעתית, מסחרית או מכל סוג אחר המסופקת או מאושרת על ידי TradingView. קרא עוד ב־תנאי השימוש.
כתב ויתור
המידע והפרסומים אינם מיועדים להיות, ואינם מהווים, ייעוץ או המלצה פיננסית, השקעתית, מסחרית או מכל סוג אחר המסופקת או מאושרת על ידי TradingView. קרא עוד ב־תנאי השימוש.