

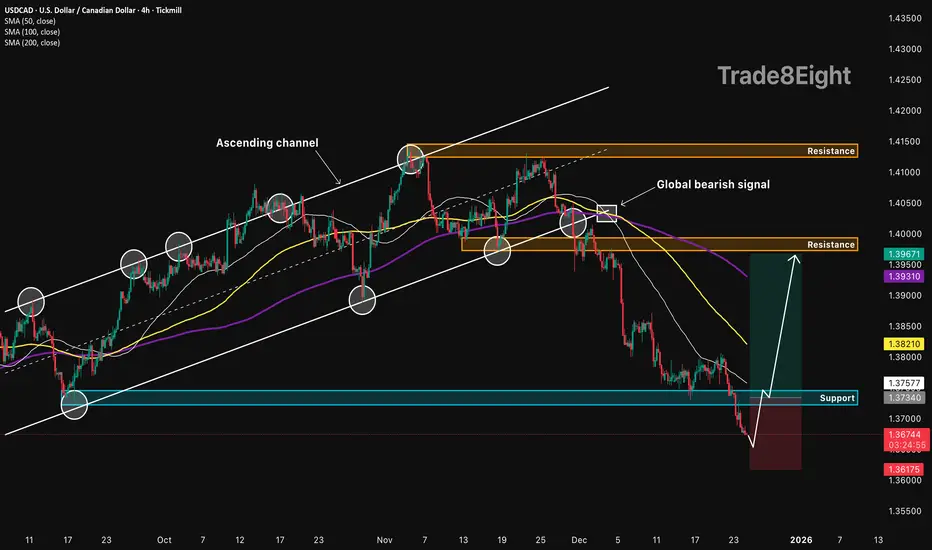
🛠 Technical Analysis: On the 4-hour (H4) timeframe, USDCAD has undergone a significant bearish correction following a breakdown from its long-term Ascending channel. A "Global bearish signal" was confirmed in early December, leading to a sharp drop that pushed the price below all major moving averages (SMA 50, 100, and 200).
Currently, the pair is trading near the support at 1.37300. The price action suggests a "v-shaped" recovery attempt as the downward momentum slows down near this multi-month low. The analysis anticipates a technical reversal (mean reversion) back toward the previous breakout zone and the SMA 50, SMA 100 cluster, targeting the resistance around 1.39500.
———————————————
❗️Trade Parameters (BUY)
———————————————
➡️ Entry Point: Buy only after the price closes above the support of 1.37300 (approx. 1.37340).
🎯 Take Profit: 1.39500 (Resistance).
🔴 Stop Loss: 1.36175 (Below the most recent swing low).
⚠️ Disclaimer: This is a potential trade idea based on current analysis; market conditions and price direction are subject to change based on news factors and volatility.
Currently, the pair is trading near the support at 1.37300. The price action suggests a "v-shaped" recovery attempt as the downward momentum slows down near this multi-month low. The analysis anticipates a technical reversal (mean reversion) back toward the previous breakout zone and the SMA 50, SMA 100 cluster, targeting the resistance around 1.39500.
———————————————
❗️Trade Parameters (BUY)
———————————————
➡️ Entry Point: Buy only after the price closes above the support of 1.37300 (approx. 1.37340).
🎯 Take Profit: 1.39500 (Resistance).
🔴 Stop Loss: 1.36175 (Below the most recent swing low).
⚠️ Disclaimer: This is a potential trade idea based on current analysis; market conditions and price direction are subject to change based on news factors and volatility.
הערה
🌍 Fundamental Analysis: As of Christmas Eve, December 24, market liquidity is significantly reduced. This "thin" market environment often triggers sharp technical bounces as institutional traders square off their short positions for the year-end. The Canadian Dollar's strength, which drove the recent decline, may face headwinds if oil prices stabilize or if the US Dollar sees a holiday safe-haven bid. This setup relies on the technical exhaustion of the recent bearish trend and a year-end rebalancing move back toward the 1.3900 handle.עסקה פעילה
העסקה בוטלה באופן ידני

⚠️ Public market view only. Not financial advice. DYOR and manage your own risk.
פרסומים קשורים
כתב ויתור
המידע והפרסומים אינם מיועדים להיות, ואינם מהווים, ייעוץ או המלצה פיננסית, השקעתית, מסחרית או מכל סוג אחר המסופקת או מאושרת על ידי TradingView. קרא עוד ב־תנאי השימוש.
⚠️ Public market view only. Not financial advice. DYOR and manage your own risk.
פרסומים קשורים
כתב ויתור
המידע והפרסומים אינם מיועדים להיות, ואינם מהווים, ייעוץ או המלצה פיננסית, השקעתית, מסחרית או מכל סוג אחר המסופקת או מאושרת על ידי TradingView. קרא עוד ב־תנאי השימוש.