

Hi traders and investors!
Daily timeframe.
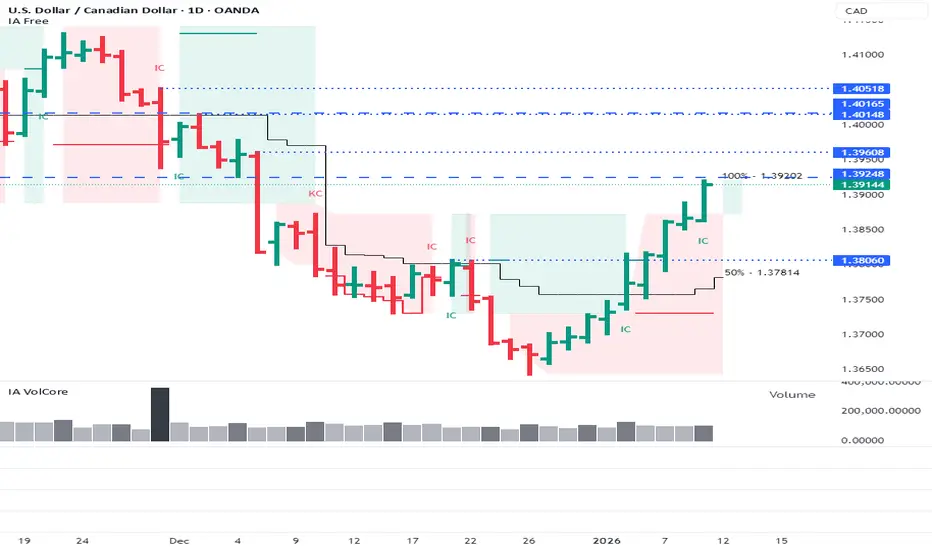
The buyer has broken above the upper boundary of the daily sideways range. However, if we continue to follow the medium-term bearish scenario for USDCAD, with targets at 1.354 and then 1.34, formulated on the monthly timeframe (see the related post), the current structure still allows for seeking short positions.

Key sell zones, where both daily and monthly levels overlap:
1️⃣ Resistance zone 1.39248–1.39608
This is the first active zone on the daily timeframe where the seller may reassert control and form a sell setup.
2️⃣ Resistance zone 1.40148–1.40518
The second zone. Short setups are also possible here, provided there is a clear seller reaction and pattern formation.
3️⃣ Return into the daily sideways range:
The seller may prevent the buyer from developing the initiative, push the price back into the daily sideways range, and absorb the buyer candle that broke above the upper boundary.
In this case, the priority would still be to look for short positions. The daily range target at 1.373 would serve as the main reference.
At the same time, there is a high probability that the price may not reach this target, with the buyer potentially resuming activity around 1.3806 or near the 50% level of the trading range.
Scenario invalidation:
If the price firmly holds above the second range, serious questions arise about whether the seller is truly ready to push the price lower.
Profitable trades!
This analysis is based on the Initiative Analysis (IA) method.
Daily timeframe.
The buyer has broken above the upper boundary of the daily sideways range. However, if we continue to follow the medium-term bearish scenario for USDCAD, with targets at 1.354 and then 1.34, formulated on the monthly timeframe (see the related post), the current structure still allows for seeking short positions.
Key sell zones, where both daily and monthly levels overlap:
1️⃣ Resistance zone 1.39248–1.39608
This is the first active zone on the daily timeframe where the seller may reassert control and form a sell setup.
2️⃣ Resistance zone 1.40148–1.40518
The second zone. Short setups are also possible here, provided there is a clear seller reaction and pattern formation.
3️⃣ Return into the daily sideways range:
The seller may prevent the buyer from developing the initiative, push the price back into the daily sideways range, and absorb the buyer candle that broke above the upper boundary.
In this case, the priority would still be to look for short positions. The daily range target at 1.373 would serve as the main reference.
At the same time, there is a high probability that the price may not reach this target, with the buyer potentially resuming activity around 1.3806 or near the 50% level of the trading range.
Scenario invalidation:
If the price firmly holds above the second range, serious questions arise about whether the seller is truly ready to push the price lower.
Profitable trades!
This analysis is based on the Initiative Analysis (IA) method.
הערה
The first monthly target at 1.354 has been reached. So far, there are no clear signs of a reversal — the initiative remains with the seller.
We will continue to monitor the situation.
The next target is 1.34.

Clarity on the Chart. Smart Trading Decisions
פרסומים קשורים
כתב ויתור
המידע והפרסומים אינם מיועדים להיות, ואינם מהווים, ייעוץ או המלצה פיננסית, השקעתית, מסחרית או מכל סוג אחר המסופקת או מאושרת על ידי TradingView. קרא עוד ב־תנאי השימוש.
Clarity on the Chart. Smart Trading Decisions
פרסומים קשורים
כתב ויתור
המידע והפרסומים אינם מיועדים להיות, ואינם מהווים, ייעוץ או המלצה פיננסית, השקעתית, מסחרית או מכל סוג אחר המסופקת או מאושרת על ידי TradingView. קרא עוד ב־תנאי השימוש.