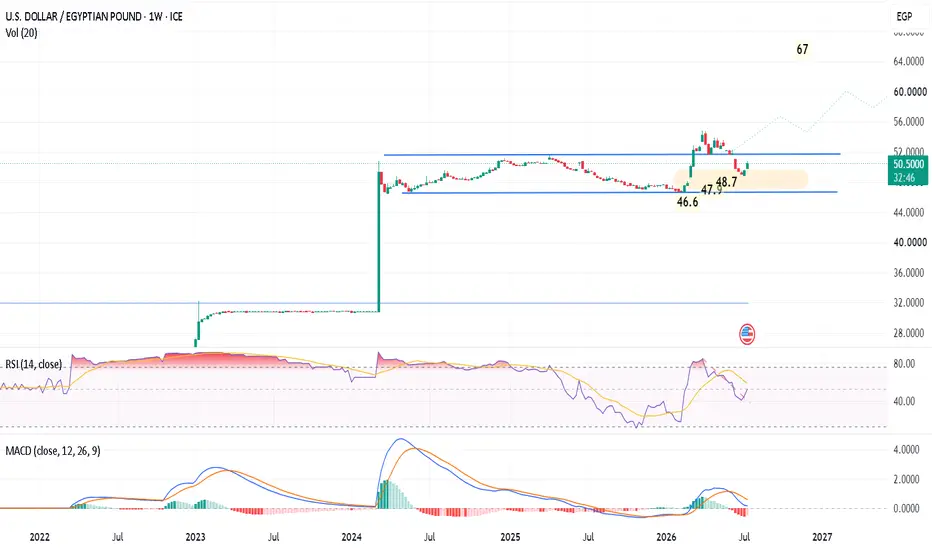

 USDEGP Weekly Chart
Consolidation Base Test & Potential Macro Breakout Setup
The USD/EGP pair is currently trading at 50.50 (+1.90% for the weekly candle), continuing its multi-month side-range consolidation following the major devaluation/float cycle of early 2024. Price action is building a well-defined accumulation base above critical demand levels.
Technical Breakdown & Market Structure
• Macro Range Bounds (46.60 – 52.00):
Since March 2024, price has been bounded within a broad horizontal consolidation range (blue channels).
o Upper Resistance: 51.50 – 52.00 EGP (Multi-touch ceiling).
o Lower Support: 46.60 EGP (Macro base).
• Ascending Accumulation Floor (46.60 / 47.90 / 48.70):
The orange highlighted demand box highlights a series of ascending higher lows (46.60 --> 47.90 --> 48.70). The strong green weekly candle currently pushing off 49.86 toward 50.50 indicates strong buyers defending the higher low structure.
• Overhead Resistance Pivot (51.50 – 52.00):
This remains the primary trigger zone for bulls. A weekly close above 52.00 will mark a structural range breakout.
Indicator Insights
• RSI (14): Currently sitting at 49.93 (Signal at 55.99). The index has stabilized near the 50 mid-line after holding above 40 during the localized dip, signaling momentum is resetting for a prospective push higher.
• MACD (12, 26, 9): MACD histogram momentum is rounding up following a period of contraction. The signal line remains positive (0.6050), reflecting long-term structural underlying strength despite the consolidation phase.
Expectations & Projections
Scenario A: Bullish Range Breakout (Primary Trend Continuation)
• Immediate Hurdle: Testing the upper range resistance band at 51.50 – 52.00.
• Breakout Trigger: A decisive weekly close above 52.00.
• Intermediate Targets: 56.00 and 60.00 psychological extension levels.
• Macro Target: 67.00 (Full vertical measure / major impulse target annotated on chart).
• Invalidation / Stop Loss: A sustained weekly breakdown below the 47.90 – 46.60 demand base.
Scenario B: Continued Range Bound Consolidation
• Rejection at the 51.50 – 52.00 horizontal resistance would send price back down to test support inside the 48.70 – 49.20 zone before another breakout attempt.
Summary: USD/EGP is printing a bullish higher-low structure within a well-defined consolidation pattern. Holding above 48.70 keeps the bias tilted upward, with a sustained close

כתב ויתור
המידע והפרסומים אינם מיועדים להיות, ואינם מהווים, ייעוץ או המלצה פיננסית, השקעתית, מסחרית או מכל סוג אחר המסופקת או מאושרת על ידי TradingView. קרא עוד ב־תנאי השימוש.
כתב ויתור
המידע והפרסומים אינם מיועדים להיות, ואינם מהווים, ייעוץ או המלצה פיננסית, השקעתית, מסחרית או מכל סוג אחר המסופקת או מאושרת על ידי TradingView. קרא עוד ב־תנאי השימוש.