

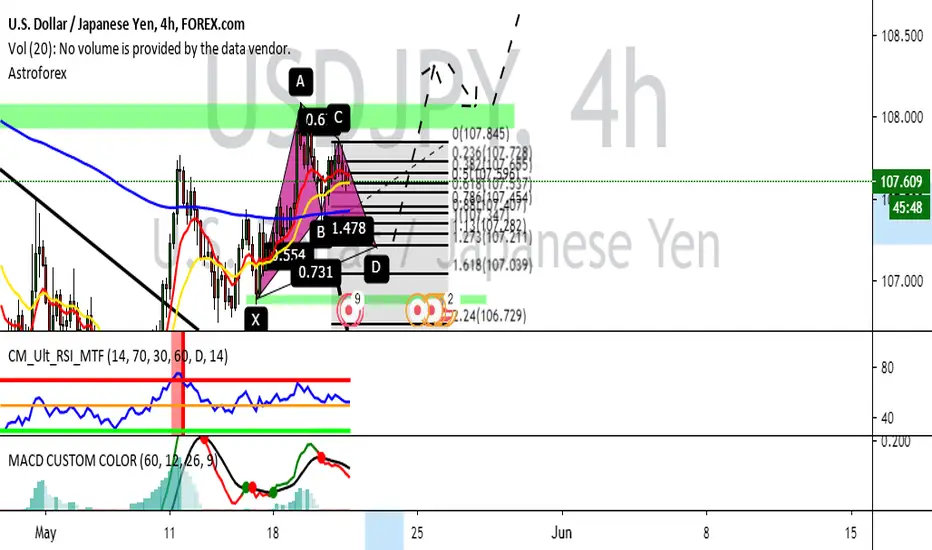
Guys, I don't trade trading this week because I make a following, but I complete my weekly to earning 15% in my DEMO account, but this is my scenario possible what USD/JPY can be. Now indicators like RSI and MACD are in the higher zone, and a possible drop of the price it's can to find down the -0.273% of Fibonacci or -0.618% of Fibonacci to complete the bullish Gartley armonic pattern. And also, and a sell it to find up 38 pips it's a great to take a consideration, and the range of 50 pips if you want to entry in a sell it. So, for me it's short position what the price do. And later going to put a buy order, but with confirmation of price action and indicators what use it.

כתב ויתור
המידע והפרסומים אינם מיועדים להיות, ואינם מהווים, ייעוץ או המלצה פיננסית, השקעתית, מסחרית או מכל סוג אחר המסופקת או מאושרת על ידי TradingView. קרא עוד ב־תנאי השימוש.
כתב ויתור
המידע והפרסומים אינם מיועדים להיות, ואינם מהווים, ייעוץ או המלצה פיננסית, השקעתית, מסחרית או מכל סוג אחר המסופקת או מאושרת על ידי TradingView. קרא עוד ב־תנאי השימוש.