
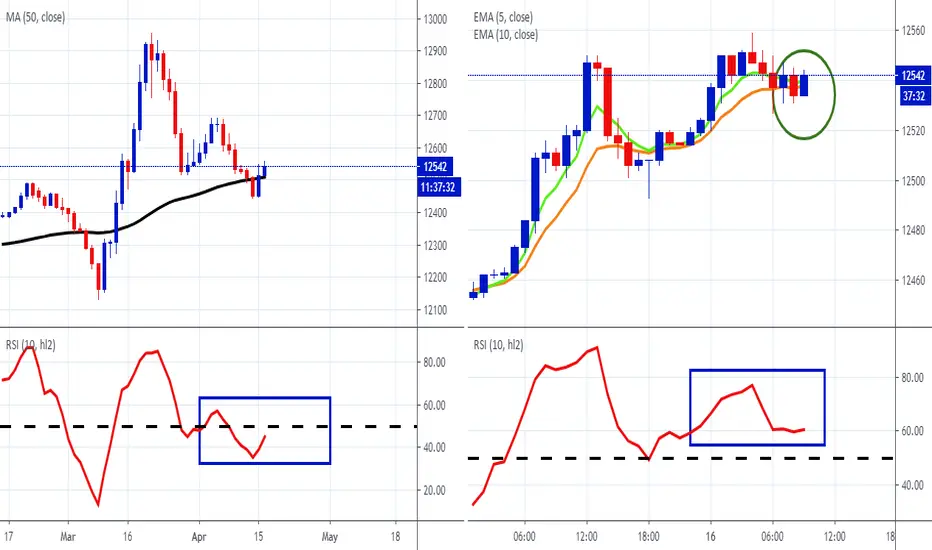
The left chart show's the daily chart of FXCM's dollar index, USDOLLAR. The instrument is holding support at the black 50-day moving average. The RSI is also looking to cross above 50, which is the bullish side of the oscillator. The right chart shows the hourly time frame. Here the RSI is already bullish and if the EMAs start moving upwards (green ellipse), the greenback is likely bid. If this is the case and the sentiment transfers to the daily time frame, the market will be moving towards a risk-off sentiment.

Follow and Trade this analysis from your Charts. FXCM now Integrated with TradingView. Contact FXCM for more information.
כתב ויתור
המידע והפרסומים אינם מיועדים להיות, ואינם מהווים, ייעוץ או המלצה פיננסית, השקעתית, מסחרית או מכל סוג אחר המסופקת או מאושרת על ידי TradingView. קרא עוד ב־תנאי השימוש.
כתב ויתור
המידע והפרסומים אינם מיועדים להיות, ואינם מהווים, ייעוץ או המלצה פיננסית, השקעתית, מסחרית או מכל סוג אחר המסופקת או מאושרת על ידי TradingView. קרא עוד ב־תנאי השימוש.