
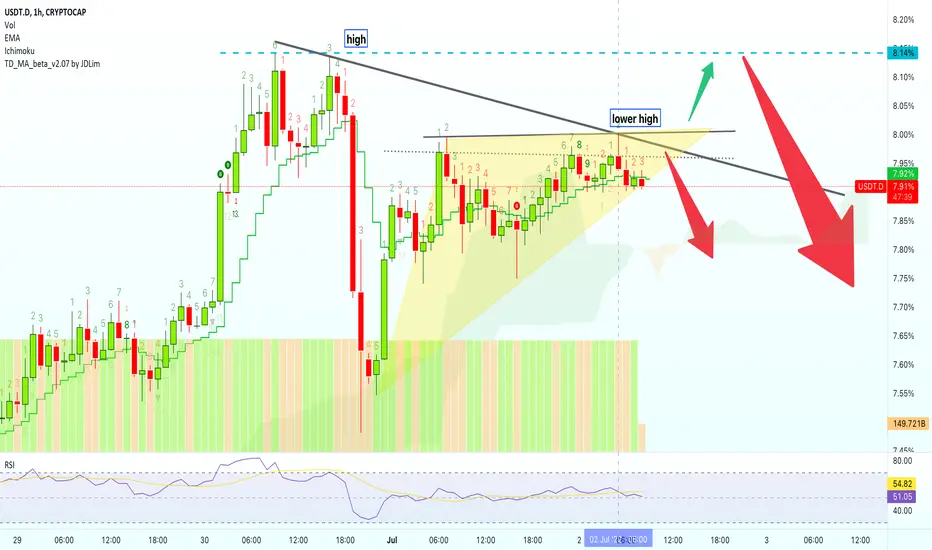
This is the chart that I have for USDT.D (Tether Dominance).
30-June sets the high and 2-July the lower high.
This is a short-term chart.
These are bearish signals but things can easily change.
Namaste.
30-June sets the high and 2-July the lower high.
This is a short-term chart.
- The marked candle 2-July '22 05:00 gives out a short/sell signals.
- The RSI trending lower to move below 50 gives out another bearish signal.
- We can also see a loss of the 10 sessions average support price at 7.92%...
These are bearish signals but things can easily change.
Namaste.

✅ Cryptocurrencies technical analysis & results
t.me/masteranandatrades/9279
✅ Stocks technical analysis
t.me/anandastocks
✅ Enjoyed the content? Join my PREMIUM channels for more... t.me/lamatrades/4 (since 2017)
t.me/masteranandatrades/9279
✅ Stocks technical analysis
t.me/anandastocks
✅ Enjoyed the content? Join my PREMIUM channels for more... t.me/lamatrades/4 (since 2017)
פרסומים קשורים
כתב ויתור
המידע והפרסומים אינם מיועדים להיות, ואינם מהווים, ייעוץ או המלצה פיננסית, השקעתית, מסחרית או מכל סוג אחר המסופקת או מאושרת על ידי TradingView. קרא עוד ב־תנאי השימוש.
✅ Cryptocurrencies technical analysis & results
t.me/masteranandatrades/9279
✅ Stocks technical analysis
t.me/anandastocks
✅ Enjoyed the content? Join my PREMIUM channels for more... t.me/lamatrades/4 (since 2017)
t.me/masteranandatrades/9279
✅ Stocks technical analysis
t.me/anandastocks
✅ Enjoyed the content? Join my PREMIUM channels for more... t.me/lamatrades/4 (since 2017)
פרסומים קשורים
כתב ויתור
המידע והפרסומים אינם מיועדים להיות, ואינם מהווים, ייעוץ או המלצה פיננסית, השקעתית, מסחרית או מכל סוג אחר המסופקת או מאושרת על ידי TradingView. קרא עוד ב־תנאי השימוש.