
USDT Dominance (USDT.D)
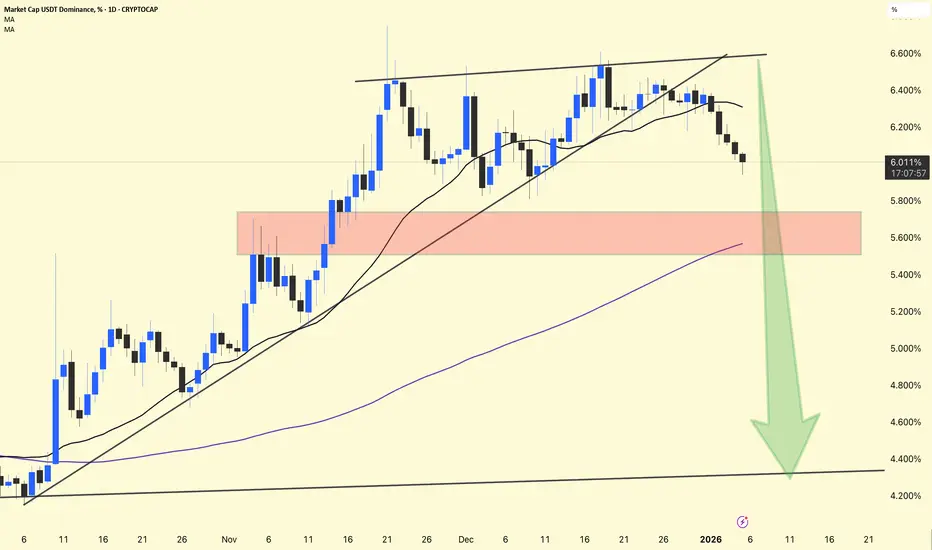
USDT.D has broken below the rising trendline & short-term MAs, showing weakness in stablecoin dominance.
Current level: ~6.01%
5.6% – 5.8% (highlighted red zone)
This is a critical support. If it fails, downside may accelerate.
Downside Targets (if support breaks):
5.2%
4.8%
Major support near 4.3% – 4.4% (long-term trendline)
Falling USDT.D = money moving from stablecoins into crypto
Supports BTC & altcoin bullish continuation
Higher probability of altcoin momentum if the breakdown continues
USDT Dominance is bearish, favoring risk-on sentiment. As long as it stays below the broken trendline, bullish pressure on crypto remains intact.
USDT.D has broken below the rising trendline & short-term MAs, showing weakness in stablecoin dominance.
Current level: ~6.01%
5.6% – 5.8% (highlighted red zone)
This is a critical support. If it fails, downside may accelerate.
Downside Targets (if support breaks):
5.2%
4.8%
Major support near 4.3% – 4.4% (long-term trendline)
Falling USDT.D = money moving from stablecoins into crypto
Supports BTC & altcoin bullish continuation
Higher probability of altcoin momentum if the breakdown continues
USDT Dominance is bearish, favoring risk-on sentiment. As long as it stays below the broken trendline, bullish pressure on crypto remains intact.

פרסומים קשורים
כתב ויתור
המידע והפרסומים אינם מיועדים להיות, ואינם מהווים, ייעוץ או המלצה פיננסית, השקעתית, מסחרית או מכל סוג אחר המסופקת או מאושרת על ידי TradingView. קרא עוד ב־תנאי השימוש.
פרסומים קשורים
כתב ויתור
המידע והפרסומים אינם מיועדים להיות, ואינם מהווים, ייעוץ או המלצה פיננסית, השקעתית, מסחרית או מכל סוג אחר המסופקת או מאושרת על ידי TradingView. קרא עוד ב־תנאי השימוש.