
USDT Dominance (1H) – Chart Update
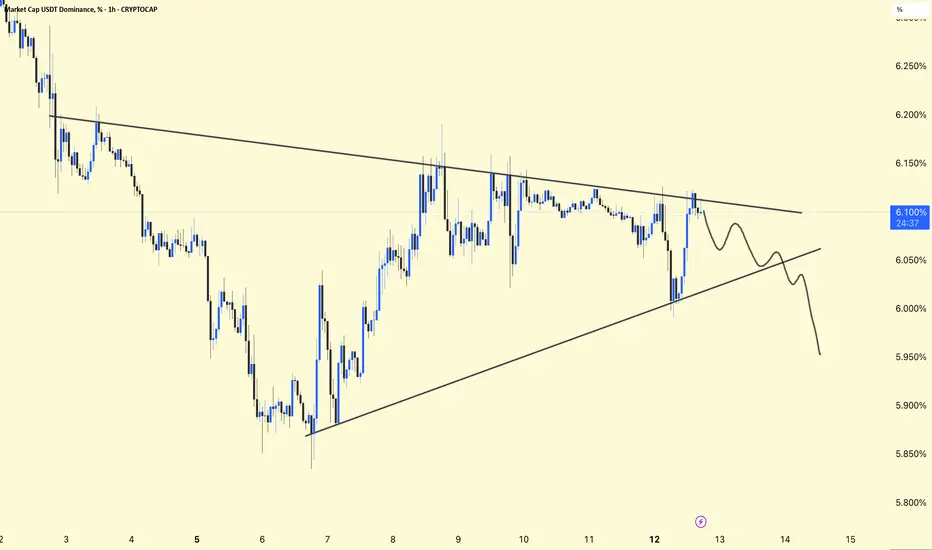
USDT.D is trading inside a symmetrical triangle, formed by a descending resistance and rising support — indicating market indecision.
Price is hovering near the upper half of the pattern, facing rejection from the descending trendline around 6.10–6.15%.
Likely move toward the rising support, which would favor risk-on sentiment and support altcoins.
Signals risk-off, increasing chances of market pullback.
Confirms capital rotation into crypto, bullish for BTC & alts.
USDT.D is at a decision point. A confirmed breakout or breakdown will define the next short-term direction for the broader crypto market. Risk management is key until clarity emerges.
USDT.D is trading inside a symmetrical triangle, formed by a descending resistance and rising support — indicating market indecision.
Price is hovering near the upper half of the pattern, facing rejection from the descending trendline around 6.10–6.15%.
Likely move toward the rising support, which would favor risk-on sentiment and support altcoins.
Signals risk-off, increasing chances of market pullback.
Confirms capital rotation into crypto, bullish for BTC & alts.
USDT.D is at a decision point. A confirmed breakout or breakdown will define the next short-term direction for the broader crypto market. Risk management is key until clarity emerges.
הערה
עסקה פעילה

פרסומים קשורים
כתב ויתור
המידע והפרסומים אינם מיועדים להיות, ואינם מהווים, ייעוץ או המלצה פיננסית, השקעתית, מסחרית או מכל סוג אחר המסופקת או מאושרת על ידי TradingView. קרא עוד ב־תנאי השימוש.
פרסומים קשורים
כתב ויתור
המידע והפרסומים אינם מיועדים להיות, ואינם מהווים, ייעוץ או המלצה פיננסית, השקעתית, מסחרית או מכל סוג אחר המסופקת או מאושרת על ידי TradingView. קרא עוד ב־תנאי השימוש.