
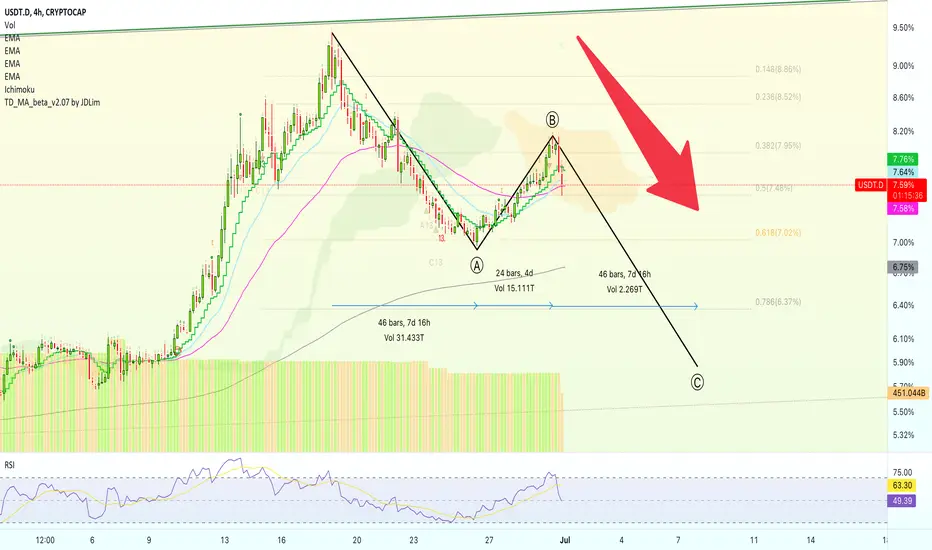
Looks like we have the complete b wave of the ABC correction we mapped a few days ago.
We can see EMA50 holding as support after a higher low.
This is set at 7.58%; This level is very likely to fail.
The RSI has gone bearish (below 50) and we have a clear lower high.
The next target is set first at 7.02% followed by 6.37%.
If we see straight down, as the chart is saying, Bitcoin will move straight up.
Namaste.

✅ Cryptocurrencies technical analysis & results
t.me/masteranandatrades/9279
✅ Stocks technical analysis
t.me/anandastocks
✅ Enjoyed the content? Join my PREMIUM channels for more... t.me/lamatrades/4 (since 2017)
t.me/masteranandatrades/9279
✅ Stocks technical analysis
t.me/anandastocks
✅ Enjoyed the content? Join my PREMIUM channels for more... t.me/lamatrades/4 (since 2017)
פרסומים קשורים
כתב ויתור
המידע והפרסומים אינם מיועדים להיות, ואינם מהווים, ייעוץ או המלצה פיננסית, השקעתית, מסחרית או מכל סוג אחר המסופקת או מאושרת על ידי TradingView. קרא עוד ב־תנאי השימוש.