
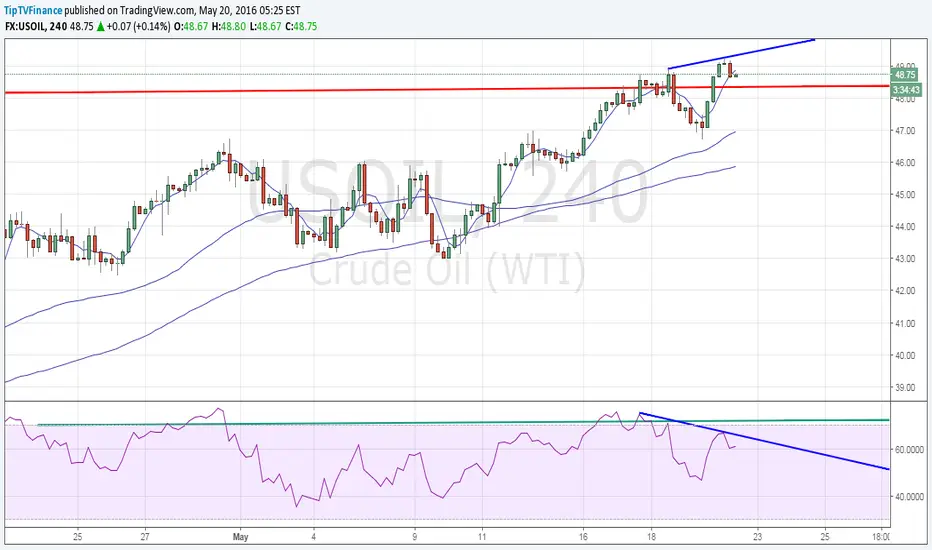
Prices hit a high of $49.14 before trimming gains to trade around $48.80 levels.
- 4-hour chart shows a bearish price RSI divergence.
- Also note, futures show a gap up opening today. The gap is between $48.22 and $48.82 levels.
- In the light of bearish price RSI divergence, prices appear likely to fill the gap ahead of NY closing.
- On a larger scheme of things, bullish invalidation is seen only if prices see a day end closing below Apr 29 high.

פרסומים קשורים
כתב ויתור
המידע והפרסומים אינם מיועדים להיות, ואינם מהווים, ייעוץ או המלצה פיננסית, השקעתית, מסחרית או מכל סוג אחר המסופקת או מאושרת על ידי TradingView. קרא עוד ב־תנאי השימוש.
פרסומים קשורים
כתב ויתור
המידע והפרסומים אינם מיועדים להיות, ואינם מהווים, ייעוץ או המלצה פיננסית, השקעתית, מסחרית או מכל סוג אחר המסופקת או מאושרת על ידי TradingView. קרא עוד ב־תנאי השימוש.