
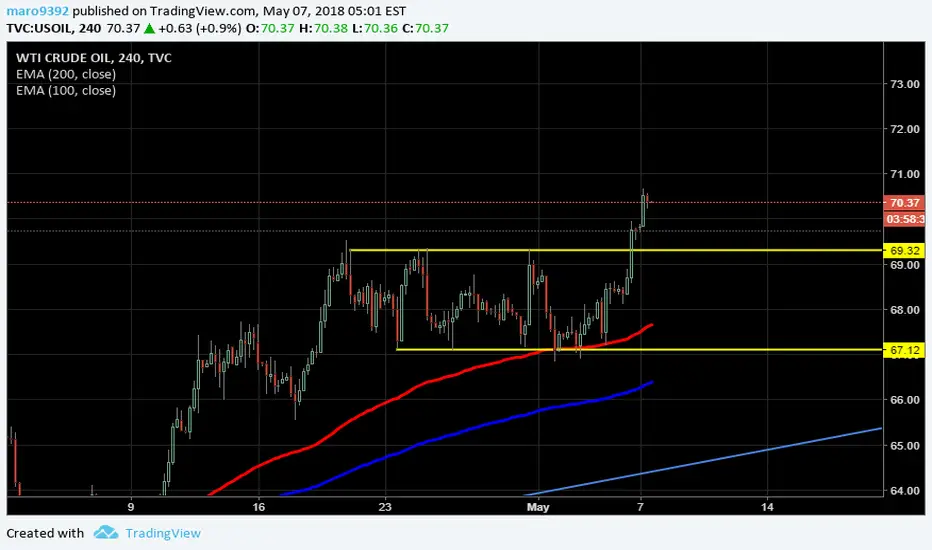
Hello traders! Today i want to show you USOIL in 4h timeframe , during the previous weeks the price moved inside a rectangle , a pattern that might indicate a continuation of the trend , in this case an uptrend or an inversion trend. EMA 100 acted as support and the price broke the rectangle and now is looking for another upside leg. We will monitor the area around 70 usd , to find some long position. Have a nice day traders!
הערה
in 4h timeframe broke the resistance but in daily timeframe hasn't been able to break it. Now is going higher , over previous highs , it might reach 80 usd area? We will seeהעסקה בוטלה באופן ידני

כתב ויתור
המידע והפרסומים אינם מיועדים להיות, ואינם מהווים, ייעוץ או המלצה פיננסית, השקעתית, מסחרית או מכל סוג אחר המסופקת או מאושרת על ידי TradingView. קרא עוד ב־תנאי השימוש.
כתב ויתור
המידע והפרסומים אינם מיועדים להיות, ואינם מהווים, ייעוץ או המלצה פיננסית, השקעתית, מסחרית או מכל סוג אחר המסופקת או מאושרת על ידי TradingView. קרא עוד ב־תנאי השימוש.