
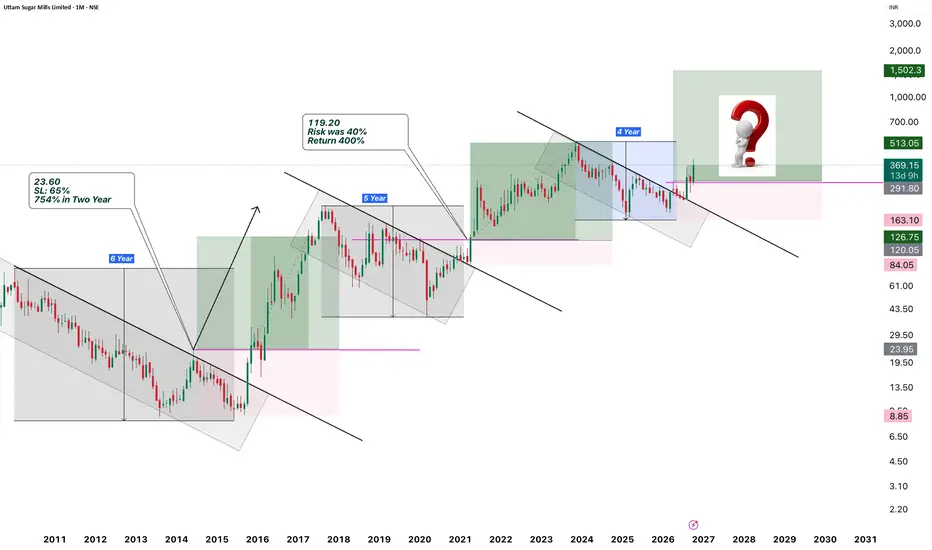
Uttam Sugar’s monthly chart presents a recurring sequence: an extended corrective phase, a breakout from descending resistance and a subsequent expansion in price.
The significance lies in the relationship between the time spent correcting, the risk associated with the breakout and the return generated afterward. Studying these elements together provides a more complete framework for assessing the latest formation.
Monthly chart: Virendra Pandey / TradingView. The chart uses a logarithmic price scale. Historical figures reflect the annotations shown; the latest upside zone is a projection.
Understanding the Structure
The chart identifies three major corrective phases lasting approximately six, five and four years.
Each phase follows a substantial decline or correction within a broader price cycle. Descending trendlines connect the major highs, while horizontal levels identify reference areas for evaluating a transition out of the corrective structure.
A break above descending resistance indicates that the previous sequence of lower highs is being challenged. Reclaiming the associated horizontal reference strengthens the structural interpretation by showing progress beyond a defined price level.
The monthly timeframe places these developments in a long-term context. Individual candles represent an entire month, so the formations describe positional opportunities developing over years.
First Cycle: Six Years of Correction, Followed by Expansion
The first highlighted phase spans approximately six years. During this period, price remained under a declining resistance structure before eventually transitioning into a strong advance.
The chart marks an opportunity near ₹23.60, with an annotated risk of approximately 65% and a subsequent return of 754% over two years.
This establishes an important distinction between identifying an attractive historical return and understanding the exposure associated with pursuing it.
A 65% distance to the marked invalidation area is substantial. It describes the potential loss between the reference entry and the structural stop; it does not establish that the position actually experienced a 65% drawdown after entry.
The cycle illustrates how a prolonged corrective structure can precede a major advance while still requiring considerable room beneath the entry.
Second Cycle: Five Years, With Lower Annotated Risk and Return
The second corrective phase lasts approximately five years.
The chart identifies the next opportunity around ₹119.20, with an annotated risk of 40% and a return of approximately 400%.
Relative to the first cycle, three changes stand out:
The corrective period shortens from six years to five.
The annotated risk declines from 65% to 40%.
The annotated return declines from 754% to 400%.
The historical comparison therefore includes both opportunity and exposure. The second cycle delivered a smaller percentage advance, accompanied by a lower annotated risk.
These percentages are reproduced from the chart’s labels. Rounded annotations and the precise anchors of the drawn position tools may differ, so they should be treated as illustrative historical measurements rather than an audited performance record.
Third Cycle: Assessing the Latest Formation
The latest marked structure covers approximately four years.
Price is shown moving above the descending trendline and the horizontal reference near ₹291.80. The illustrated position uses a lower boundary of ₹163.10 and an upside projection of ₹1,502.30.
The resulting calculations are:
Component Illustrated level or calculation
Entry reference ₹291.80
Structural stop reference ₹163.10
Risk per share ₹128.70
Downside from entry 44.1%
Projected target ₹1,502.30
Potential gain per share ₹1,210.50
Projected upside from entry 414.8%
Illustrated reward-to-risk ratio 9.4:1
The downside percentage is calculated by dividing the distance between entry and stop by the entry price. The projected return uses the distance between entry and target on the same basis.
These figures describe the setup from ₹291.80. An entry at a higher price, with the same stop and target, produces greater downside exposure and a lower reward-to-risk ratio.
Comparing Time, Risk and Return
The complete comparison is:
Cycle Corrective duration Risk Return Status
First Approximately 6 years 65% 754% over two years Historical annotation
Second Approximately 5 years 40% 400% Historical annotation
Third Approximately 4 years 44.1% 414.8% Calculated from projected setup
The duration of the marked corrections decreases across the three phases. Risk and return do not follow an uninterrupted downward sequence.
Instead, the latest illustrated setup is closer to the second cycle in percentage risk and return potential.
This is a useful historical resemblance. Two completed examples do not establish a statistically reliable rule linking correction duration to future returns. Also, the six-, five- and four-year labels measure the corrective phases; they do not establish how long the latest target would take to reach.
Why ₹513.05 Matters
The previous major high near ₹513.05 is an important intermediate reference.
A breakout from descending resistance changes the local structure. Advancing through the previous major high would provide further evidence that the move is developing into a broader expansion.
Price behaviour around this area—whether it holds gains, consolidates or faces sustained rejection—will help assess the strength of the emerging cycle.
The larger ₹1,502.30 objective should therefore be understood as a projected destination with meaningful structure between entry and target. Its exact derivation is not specified in the chart.
Risk Distance and Portfolio Exposure
The approximately 44% stop distance in the latest illustration is the risk attached to the position’s entry-to-stop range. Portfolio exposure depends on position size.
For example, allocating 5% of a portfolio to a position with a 44.1% stop distance implies approximately 2.2% portfolio exposure, assuming execution at the planned stop. Price gaps, liquidity and execution costs can change the realised loss.
A high projected reward-to-risk ratio also does not establish the probability of success. It describes the relationship between two price distances; the market must still validate the structure.
The Analytical View
Uttam Sugar’s chart offers a clear framework for studying repeated market behaviour: extended correction, structural breakout and potential expansion.
The latest formation has similarities to earlier cycles, particularly in its illustrated risk and return profile. The central task is to assess whether price continues to support that comparison as it approaches subsequent resistance.
Time provides context, structure defines invalidation, and return potential measures the opportunity. Together, they form the basis of this analysis.
Disclosure: This article interprets the supplied chart for educational purposes and is not a recommendation to buy or sell. Historical annotations are not independently verified performance results. Projected returns are not assured. The latest monthly candle shown is incomplete.
The significance lies in the relationship between the time spent correcting, the risk associated with the breakout and the return generated afterward. Studying these elements together provides a more complete framework for assessing the latest formation.
Monthly chart: Virendra Pandey / TradingView. The chart uses a logarithmic price scale. Historical figures reflect the annotations shown; the latest upside zone is a projection.
Understanding the Structure
The chart identifies three major corrective phases lasting approximately six, five and four years.
Each phase follows a substantial decline or correction within a broader price cycle. Descending trendlines connect the major highs, while horizontal levels identify reference areas for evaluating a transition out of the corrective structure.
A break above descending resistance indicates that the previous sequence of lower highs is being challenged. Reclaiming the associated horizontal reference strengthens the structural interpretation by showing progress beyond a defined price level.
The monthly timeframe places these developments in a long-term context. Individual candles represent an entire month, so the formations describe positional opportunities developing over years.
First Cycle: Six Years of Correction, Followed by Expansion
The first highlighted phase spans approximately six years. During this period, price remained under a declining resistance structure before eventually transitioning into a strong advance.
The chart marks an opportunity near ₹23.60, with an annotated risk of approximately 65% and a subsequent return of 754% over two years.
This establishes an important distinction between identifying an attractive historical return and understanding the exposure associated with pursuing it.
A 65% distance to the marked invalidation area is substantial. It describes the potential loss between the reference entry and the structural stop; it does not establish that the position actually experienced a 65% drawdown after entry.
The cycle illustrates how a prolonged corrective structure can precede a major advance while still requiring considerable room beneath the entry.
Second Cycle: Five Years, With Lower Annotated Risk and Return
The second corrective phase lasts approximately five years.
The chart identifies the next opportunity around ₹119.20, with an annotated risk of 40% and a return of approximately 400%.
Relative to the first cycle, three changes stand out:
The corrective period shortens from six years to five.
The annotated risk declines from 65% to 40%.
The annotated return declines from 754% to 400%.
The historical comparison therefore includes both opportunity and exposure. The second cycle delivered a smaller percentage advance, accompanied by a lower annotated risk.
These percentages are reproduced from the chart’s labels. Rounded annotations and the precise anchors of the drawn position tools may differ, so they should be treated as illustrative historical measurements rather than an audited performance record.
Third Cycle: Assessing the Latest Formation
The latest marked structure covers approximately four years.
Price is shown moving above the descending trendline and the horizontal reference near ₹291.80. The illustrated position uses a lower boundary of ₹163.10 and an upside projection of ₹1,502.30.
The resulting calculations are:
Component Illustrated level or calculation
Entry reference ₹291.80
Structural stop reference ₹163.10
Risk per share ₹128.70
Downside from entry 44.1%
Projected target ₹1,502.30
Potential gain per share ₹1,210.50
Projected upside from entry 414.8%
Illustrated reward-to-risk ratio 9.4:1
The downside percentage is calculated by dividing the distance between entry and stop by the entry price. The projected return uses the distance between entry and target on the same basis.
These figures describe the setup from ₹291.80. An entry at a higher price, with the same stop and target, produces greater downside exposure and a lower reward-to-risk ratio.
Comparing Time, Risk and Return
The complete comparison is:
Cycle Corrective duration Risk Return Status
First Approximately 6 years 65% 754% over two years Historical annotation
Second Approximately 5 years 40% 400% Historical annotation
Third Approximately 4 years 44.1% 414.8% Calculated from projected setup
The duration of the marked corrections decreases across the three phases. Risk and return do not follow an uninterrupted downward sequence.
Instead, the latest illustrated setup is closer to the second cycle in percentage risk and return potential.
This is a useful historical resemblance. Two completed examples do not establish a statistically reliable rule linking correction duration to future returns. Also, the six-, five- and four-year labels measure the corrective phases; they do not establish how long the latest target would take to reach.
Why ₹513.05 Matters
The previous major high near ₹513.05 is an important intermediate reference.
A breakout from descending resistance changes the local structure. Advancing through the previous major high would provide further evidence that the move is developing into a broader expansion.
Price behaviour around this area—whether it holds gains, consolidates or faces sustained rejection—will help assess the strength of the emerging cycle.
The larger ₹1,502.30 objective should therefore be understood as a projected destination with meaningful structure between entry and target. Its exact derivation is not specified in the chart.
Risk Distance and Portfolio Exposure
The approximately 44% stop distance in the latest illustration is the risk attached to the position’s entry-to-stop range. Portfolio exposure depends on position size.
For example, allocating 5% of a portfolio to a position with a 44.1% stop distance implies approximately 2.2% portfolio exposure, assuming execution at the planned stop. Price gaps, liquidity and execution costs can change the realised loss.
A high projected reward-to-risk ratio also does not establish the probability of success. It describes the relationship between two price distances; the market must still validate the structure.
The Analytical View
Uttam Sugar’s chart offers a clear framework for studying repeated market behaviour: extended correction, structural breakout and potential expansion.
The latest formation has similarities to earlier cycles, particularly in its illustrated risk and return profile. The central task is to assess whether price continues to support that comparison as it approaches subsequent resistance.
Time provides context, structure defines invalidation, and return potential measures the opportunity. Together, they form the basis of this analysis.
Disclosure: This article interprets the supplied chart for educational purposes and is not a recommendation to buy or sell. Historical annotations are not independently verified performance results. Projected returns are not assured. The latest monthly candle shown is incomplete.

Telegram: t.me/Virendrapandey81
Website: vpcapitalresearch.com
Follow us on Twitter: twitter.com/Virupandey81
YouTube: youtube.com/@codeviser
Website: vpcapitalresearch.com
Follow us on Twitter: twitter.com/Virupandey81
YouTube: youtube.com/@codeviser
כתב ויתור
המידע והפרסומים אינם מיועדים להיות, ואינם מהווים, ייעוץ או המלצה פיננסית, השקעתית, מסחרית או מכל סוג אחר המסופקת או מאושרת על ידי TradingView. קרא עוד ב־תנאי השימוש.
Telegram: t.me/Virendrapandey81
Website: vpcapitalresearch.com
Follow us on Twitter: twitter.com/Virupandey81
YouTube: youtube.com/@codeviser
Website: vpcapitalresearch.com
Follow us on Twitter: twitter.com/Virupandey81
YouTube: youtube.com/@codeviser
כתב ויתור
המידע והפרסומים אינם מיועדים להיות, ואינם מהווים, ייעוץ או המלצה פיננסית, השקעתית, מסחרית או מכל סוג אחר המסופקת או מאושרת על ידי TradingView. קרא עוד ב־תנאי השימוש.