
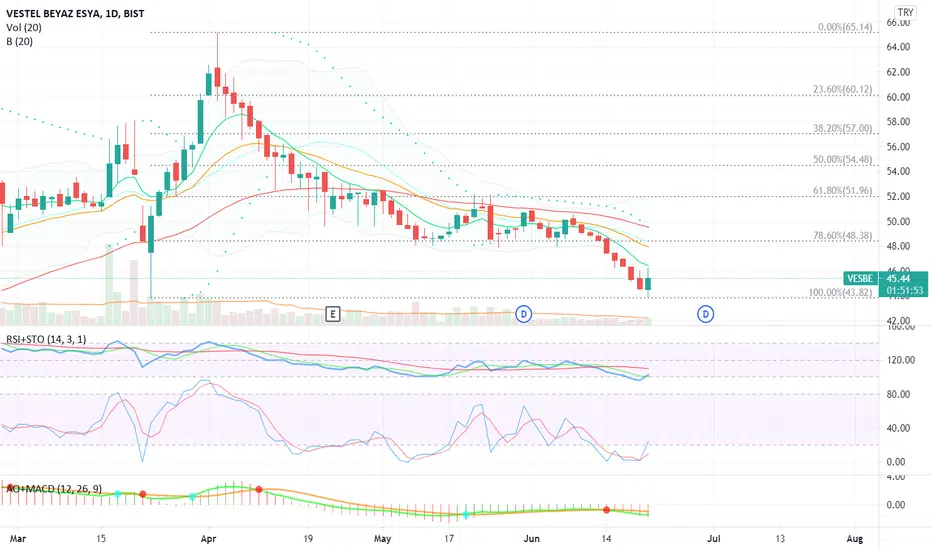
VESBE is technically below (8, 20 and 50 days) moving averages and the recent value is at the bottom of Bollinger Band, but
- RSI cuts up 30
- Stochastic cuts up 20
- Wavetrend is in the oversold area and may need a few more days to cuts up the lower threshold
- Finally, according to its fundamental analysis, VESBE is strong for next 1 year.
I will check VESBE in these days. It touched its 200 days moving average. This point can be a good opportunity to earn up to 10 %. At 48, there is 50 days moving average.
Regards,
Fatih

כתב ויתור
המידע והפרסומים אינם מיועדים להיות, ואינם מהווים, ייעוץ או המלצה פיננסית, השקעתית, מסחרית או מכל סוג אחר המסופקת או מאושרת על ידי TradingView. קרא עוד ב־תנאי השימוש.
כתב ויתור
המידע והפרסומים אינם מיועדים להיות, ואינם מהווים, ייעוץ או המלצה פיננסית, השקעתית, מסחרית או מכל סוג אחר המסופקת או מאושרת על ידי TradingView. קרא עוד ב־תנאי השימוש.