
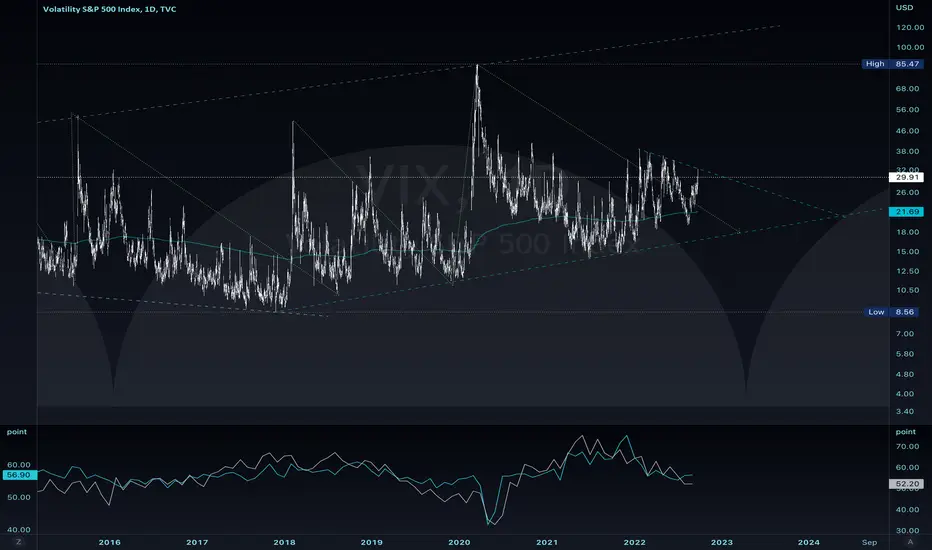
A macro view of VIX versus US Manufacturing and Non-Manufacturing PMI's with a visual aid for base time cycles.
Taking note without special emphasis of the 200 Week EMA of the VIX, which may be utilized as a confirming indicator a period of continued elevated volatility.
Chart is intended as a simple visual aid for contraction and expansion periods in the US economy.
Taking note without special emphasis of the 200 Week EMA of the VIX, which may be utilized as a confirming indicator a period of continued elevated volatility.
Chart is intended as a simple visual aid for contraction and expansion periods in the US economy.

כתב ויתור
המידע והפרסומים אינם מיועדים להיות, ואינם מהווים, ייעוץ או המלצה פיננסית, השקעתית, מסחרית או מכל סוג אחר המסופקת או מאושרת על ידי TradingView. קרא עוד ב־תנאי השימוש.
כתב ויתור
המידע והפרסומים אינם מיועדים להיות, ואינם מהווים, ייעוץ או המלצה פיננסית, השקעתית, מסחרית או מכל סוג אחר המסופקת או מאושרת על ידי TradingView. קרא עוד ב־תנאי השימוש.