Welspun Enterprises Ltd – Ascending Triangle Breakout Setup
 WELENT
📈 Pattern & Setup:
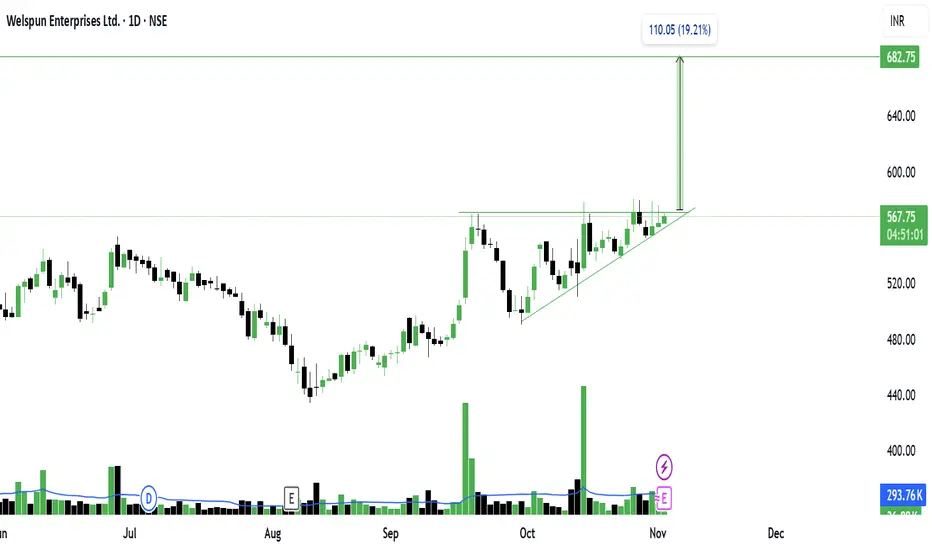
Welspun Enterprises is forming a classic ascending triangle pattern — a strong continuation structure that often precedes sharp breakouts. The series of higher lows since mid-October clearly shows accumulation pressure building beneath resistance around 570.
Each shakeout in this structure has been quickly absorbed by buyers, a strong sign of institutional interest. The latest candle is again testing the resistance zone with volume picking up, indicating breakout momentum is brewing.
A confirmed close above 575 can open the gates for a 19% upside move toward the 680 zone.
📝 Trade Plan:
✍Entry: Above 575 (confirmation of breakout)
🚩Stop-Loss: 540 (below recent higher low)
🎯Targets:
Target 1 → 620
Target 2 → 680 (around 19% potential move)
💡 Pyramiding Strategy:
1. Enter 60% above 575 with a strong volume breakout
2. Add 40% above 590 after price sustains above resistance
3. Trail stop-loss to 555 once the stock trades above 600
🧠 Logic Behind the Setup:
The pattern combines multiple Wyckoff elements — repeated shakeouts, steady higher lows, and a clear horizontal supply zone at the top. This shows that sellers are being gradually overpowered while demand is increasing.
Volume contraction within the triangle and expansion near resistance further strengthen the probability of a sustained breakout.
Keep Learning. Keep Earning.
Let’s grow together 📚🎯
🔴Disclaimer:
This analysis is for educational purposes only. Not a buy/sell recommendation. Please do your own research or consult your financial advisor before trading.
WELENT 📈 Pattern & Setup:
Welspun Enterprises is forming a classic ascending triangle pattern — a strong continuation structure that often precedes sharp breakouts. The series of higher lows since mid-October clearly shows accumulation pressure building beneath resistance around 570.
Each shakeout in this structure has been quickly absorbed by buyers, a strong sign of institutional interest. The latest candle is again testing the resistance zone with volume picking up, indicating breakout momentum is brewing.
A confirmed close above 575 can open the gates for a 19% upside move toward the 680 zone.
📝 Trade Plan:
✍Entry: Above 575 (confirmation of breakout)
🚩Stop-Loss: 540 (below recent higher low)
🎯Targets:
Target 1 → 620
Target 2 → 680 (around 19% potential move)
💡 Pyramiding Strategy:
1. Enter 60% above 575 with a strong volume breakout
2. Add 40% above 590 after price sustains above resistance
3. Trail stop-loss to 555 once the stock trades above 600
🧠 Logic Behind the Setup:
The pattern combines multiple Wyckoff elements — repeated shakeouts, steady higher lows, and a clear horizontal supply zone at the top. This shows that sellers are being gradually overpowered while demand is increasing.
Volume contraction within the triangle and expansion near resistance further strengthen the probability of a sustained breakout.
Keep Learning. Keep Earning.
Let’s grow together 📚🎯
🔴Disclaimer:
This analysis is for educational purposes only. Not a buy/sell recommendation. Please do your own research or consult your financial advisor before trading.

TrendX INC
פרסומים קשורים
כתב ויתור
המידע והפרסומים אינם מיועדים להיות, ואינם מהווים, ייעוץ או המלצה פיננסית, השקעתית, מסחרית או מכל סוג אחר המסופקת או מאושרת על ידי TradingView. קרא עוד ב־תנאי השימוש.
TrendX INC
פרסומים קשורים
כתב ויתור
המידע והפרסומים אינם מיועדים להיות, ואינם מהווים, ייעוץ או המלצה פיננסית, השקעתית, מסחרית או מכל סוג אחר המסופקת או מאושרת על ידי TradingView. קרא עוד ב־תנאי השימוש.