
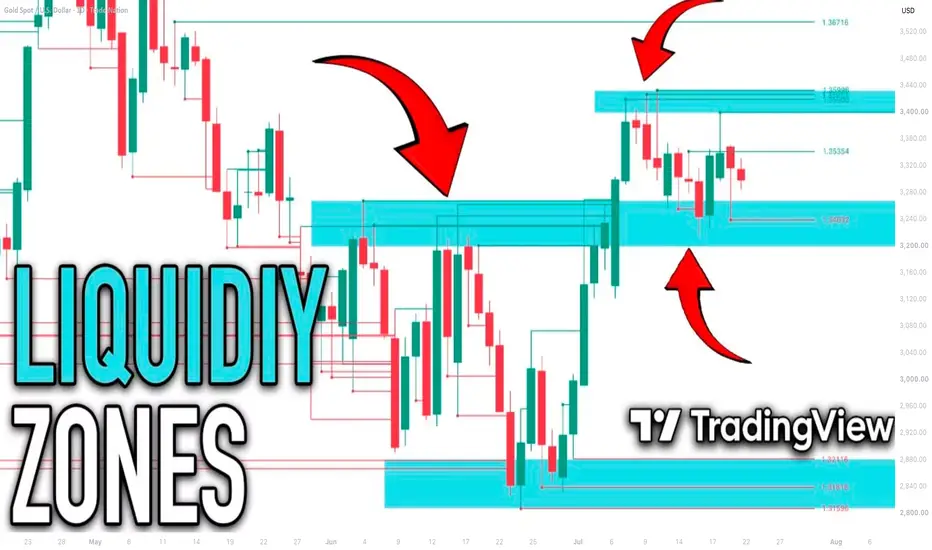
This indicator will help you find significant liquidity zones on any market and any time frame.
It is free, and it is available on TradingView.
In this article, I will explain the settings of this indicator and how to use it.
Let me start by explaining how I identify significant liquidity zones.
To me, the main indicator of a high concentration of liquidity is the formation of multiple long wicks within the same area.
Long wicks signify price rejections and active participation of buyers and sellers.
Multiple upper wicks rejected from the same highs will mean a dense concentration of supply.
While multiple lower wicks rejected from roughly the same lows will mean a solid concentration of demand.
There is one useful indicator on TradingView that accurately identifies such wicks.
It is called Long Wick Detector by LuxAlgo.
Once you click on that, it will immediately start working.
Let's discuss the settings of this indicator:
Wick Threshold - that's the most important setting.
It defines how big a candle wick must be to be considered "long" and get picked by the indicator.
This input controls the sensitivity of the indicator.
The indicator compares the wick length to recent market volatility (usually based on ATR).
For the identification of liquidity zones on Forex market on a daily time frame, I use 0.25 input.
But please note that this parameter will be different based on the market and time frame that you analyse.
Level % means where exactly the indicator will draw a horizontal line.
- With 100% default input, horizontal lines will be plotted on highs/lows of the wicks.
- While with 50%, horizontal lines will be in the middle of them.
I suggest leaving 100% input.
Duration means how long the horizontal lines stay visible on your chart in the candle bars range.
I suggest changing the default number to 100.
After 100 candles, the line disappears automatically if the price has not touched it again.
Finally, keep the "Mitigated Wicks" checkbox selected.
Unselecting that, the indicator will hide price levels that were already tested by the price, leaving only untouched ones.
And here is how to use this indicator to find liquidity zones.
You will need to find areas on your chart where at least 3 horizontal lines cluster.
It will indicate a concentration of market liquidity.
Simply unite such horizontal lines into one single area.
It will be a significant liquidity zone.
Setting up this indicator properly, it will help you find liquidity on any market.
Use it to find significant supply and demand zones on TradingView and try to integrate that with your trading strategy.
❤️Please, support my work with like, thank you!❤️
I am part of Trade Nation's Influencer program and receive a monthly fee for using their TradingView charts in my analysis.
הערה
Check my new educational article:

✅My Telegram Channel: t.me/VasilyTrading
❗️YouTube Channel: youtube.com/c/VasilyTrader
✅ Facebook: facebook.com/VasilyTrading/
⭐ Get 100% Deposit Bonus: bit.ly/bestforexgoldbroker
❗️YouTube Channel: youtube.com/c/VasilyTrader
✅ Facebook: facebook.com/VasilyTrading/
⭐ Get 100% Deposit Bonus: bit.ly/bestforexgoldbroker
פרסומים קשורים
כתב ויתור
המידע והפרסומים אינם מיועדים להיות, ואינם מהווים, ייעוץ או המלצה פיננסית, השקעתית, מסחרית או מכל סוג אחר המסופקת או מאושרת על ידי TradingView. קרא עוד ב־תנאי השימוש.
✅My Telegram Channel: t.me/VasilyTrading
❗️YouTube Channel: youtube.com/c/VasilyTrader
✅ Facebook: facebook.com/VasilyTrading/
⭐ Get 100% Deposit Bonus: bit.ly/bestforexgoldbroker
❗️YouTube Channel: youtube.com/c/VasilyTrader
✅ Facebook: facebook.com/VasilyTrading/
⭐ Get 100% Deposit Bonus: bit.ly/bestforexgoldbroker
פרסומים קשורים
כתב ויתור
המידע והפרסומים אינם מיועדים להיות, ואינם מהווים, ייעוץ או המלצה פיננסית, השקעתית, מסחרית או מכל סוג אחר המסופקת או מאושרת על ידי TradingView. קרא עוד ב־תנאי השימוש.