
Bias: Bullish Rebound After Sharp Sell-Off
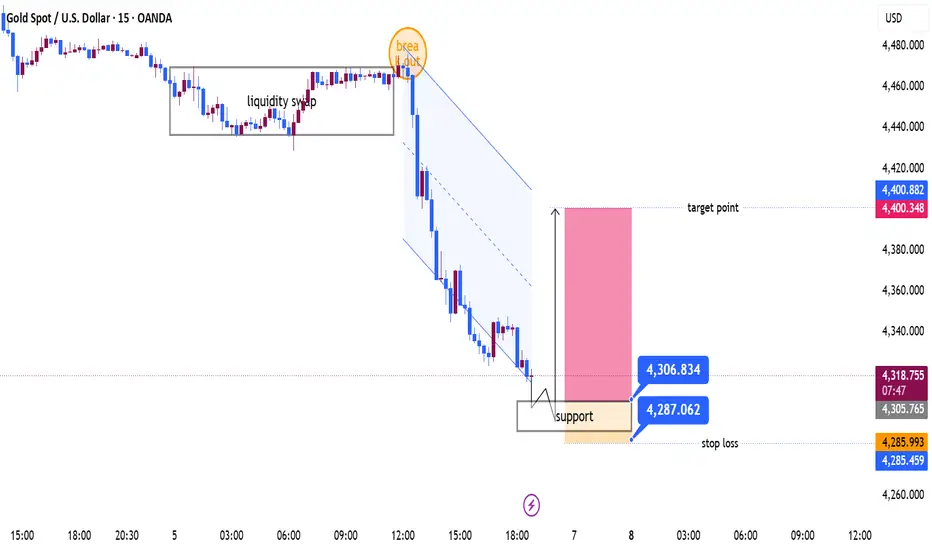
The chart shows a strong bearish impulse following a breakout failure near the 4,465–4,470 resistance zone. After taking liquidity from the range highs, sellers aggressively pushed price lower, creating a clear descending channel and driving XAU/USD into a significant support area around 4,287–4,306.
Key Observations
Liquidity Grab & Rejection: Price swept liquidity above the consolidation range before reversing sharply lower.
Bearish Channel: The decline formed a well-defined descending structure, confirming strong short-term bearish momentum.
Support Zone: Price is now testing a demand area between 4,287 and 4,306, where buyers may step in.
Potential Correction: The projected setup suggests a relief rally from support after the extended sell-off.
Bullish Scenario
If buyers defend the support zone:
Entry region: 4,287 – 4,306
Stop Loss: Below 4,286
Upside target: 4,400
The move would represent a retracement toward the previous breakdown area and channel resistance.
Bearish Invalidation
A decisive break below 4,286 would invalidate the bullish rebound idea.
In that case, sellers could continue targeting lower support levels beneath the current demand zone.
Trading Outlook
The market is currently oversold after a strong impulsive drop. A short-term bullish correction toward 4,400 is possible as long as the 4,287 support area holds. Traders should monitor bullish confirmation signals such as strong rejection candles, higher lows, or a break of the immediate descending trendline before entering long positions.
The chart shows a strong bearish impulse following a breakout failure near the 4,465–4,470 resistance zone. After taking liquidity from the range highs, sellers aggressively pushed price lower, creating a clear descending channel and driving XAU/USD into a significant support area around 4,287–4,306.
Key Observations
Liquidity Grab & Rejection: Price swept liquidity above the consolidation range before reversing sharply lower.
Bearish Channel: The decline formed a well-defined descending structure, confirming strong short-term bearish momentum.
Support Zone: Price is now testing a demand area between 4,287 and 4,306, where buyers may step in.
Potential Correction: The projected setup suggests a relief rally from support after the extended sell-off.
Bullish Scenario
If buyers defend the support zone:
Entry region: 4,287 – 4,306
Stop Loss: Below 4,286
Upside target: 4,400
The move would represent a retracement toward the previous breakdown area and channel resistance.
Bearish Invalidation
A decisive break below 4,286 would invalidate the bullish rebound idea.
In that case, sellers could continue targeting lower support levels beneath the current demand zone.
Trading Outlook
The market is currently oversold after a strong impulsive drop. A short-term bullish correction toward 4,400 is possible as long as the 4,287 support area holds. Traders should monitor bullish confirmation signals such as strong rejection candles, higher lows, or a break of the immediate descending trendline before entering long positions.

join my telegram channel t.me/goldsignalicthttps://t.me/goldsignalicthttps://t.me/goldsignalict
כתב ויתור
המידע והפרסומים אינם מיועדים להיות, ואינם מהווים, ייעוץ או המלצה פיננסית, השקעתית, מסחרית או מכל סוג אחר המסופקת או מאושרת על ידי TradingView. קרא עוד ב־תנאי השימוש.
join my telegram channel t.me/goldsignalicthttps://t.me/goldsignalicthttps://t.me/goldsignalict
כתב ויתור
המידע והפרסומים אינם מיועדים להיות, ואינם מהווים, ייעוץ או המלצה פיננסית, השקעתית, מסחרית או מכל סוג אחר המסופקת או מאושרת על ידי TradingView. קרא עוד ב־תנאי השימוש.