
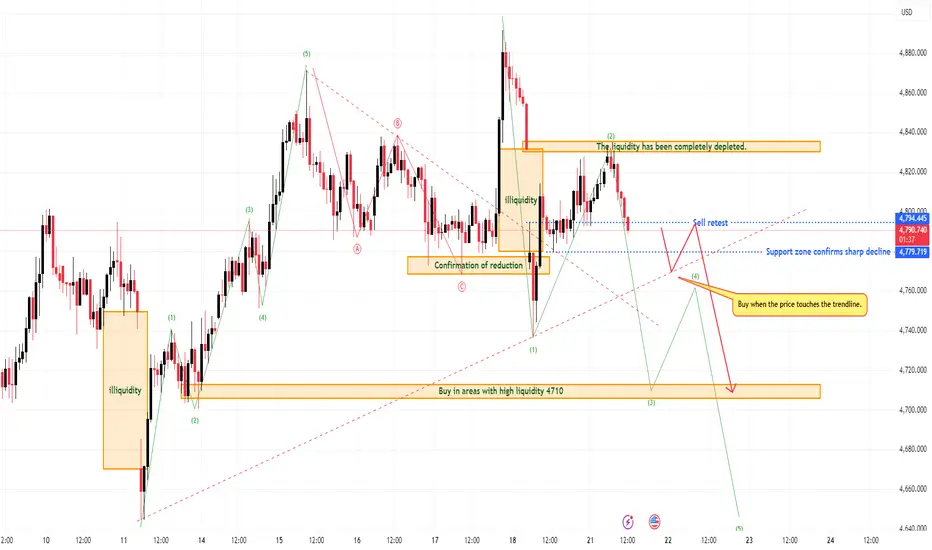
Wave 2 rebound is running into resistance again
Gold is moving into a very sensitive area where the current recovery still looks more corrective than impulsively bullish.
For Kelly, this matters because the chart is not reclaiming trend yet — it is only pushing back into a medium-term sell zone, which keeps the downside scenario active unless buyers can prove much more above current levels.
The political backdrop is also adding another layer of uncertainty. Resistance to Trump’s Fed-chair plan has increased in the Senate, and the standoff around Jerome Powell’s investigation is being framed as a question of Fed independence rather than only personnel. That keeps market uncertainty elevated heading into the week.
Technical structure
The chart still shows gold trapped inside a broader corrective framework, with price now testing the 4812 resistance band after a sharp rebound from lower levels.
This area matters for three reasons:
it is marked as the medium-term sell zone
price is still struggling to build acceptance above it
the structure beneath it continues to show weaker recovery quality rather than a clean breakout
Below current price, the technical map remains relatively clear:
4794 is the local pivot and immediate reaction line
4769 is the first confirmation level if weakness starts expanding again
4710 is the next high-liquidity support area and the first deeper downside objective
So technically, the current move still looks more like a retest into supply than the start of a new bullish leg.
Elliott structure
From an Elliott point of view, the chart is lining up more cleanly with a wave 2 rebound inside a broader bearish sequence.
That means the logic is straightforward:
the first downside leg has already been formed
the current recovery is retracing part of that decline
if resistance continues to hold, the next move could be the beginning of wave 3 lower
This is why the current zone is so important.
Wave 2 often looks convincing while it is unfolding, because price can recover sharply and retest overhead structure. But if that rebound begins to stall under supply, it usually means the market is not rebuilding trend — it is only correcting before the next directional leg.
For Kelly, the current chart fits that description well.
What matters next
The next read comes from how gold behaves around 4812 and then around 4769.
Bearish scenario
If price remains capped below the medium-term sell zone and starts slipping under 4769, then the wave-2 rebound is likely near completion.
That would make the path toward 4710 much more natural.
If 4710 also fails to hold, then the structure opens room for a deeper continuation lower.
Invalidation scenario
If buyers reclaim 4812 decisively and hold above it, then the bearish wave count loses quality.
That would delay the sell setup and suggest the market needs a broader re-evaluation.
Right now, however, price is still reacting under resistance — not breaking through it cleanly.
Macro backdrop
The macro side supports a cautious rather than aggressively bullish read.
Kevin Warsh’s nomination remains tied up in a Senate impasse, and there are still only weeks before Powell’s chair term ends, which adds uncertainty around how Fed leadership risk will be resolved.
For gold, that means volatility can stay elevated.
But for Kelly, volatility alone is not a signal. Structure still leads.
Kelly’s read
This is still a sell-the-wave-2 chart.
The rebound is visible, but it is happening into a mapped resistance zone and inside a broader defensive structure.
That keeps the downside scenario more attractive unless buyers can reclaim and hold above the current ceiling.
For Kelly, the cleaner approach is to let resistance decide.
As long as gold stays below 4812, the chart still leans toward another move lower, with 4769 as the first trigger and 4710 as the next key liquidity reference.
Conclusion
Gold is rebounding, but the recovery still looks corrective.
The Elliott structure on the chart suggests price may be finishing wave 2 inside a broader bearish sequence, while the 4812 resistance zone remains the key area where sellers can take control again.
As long as that zone holds, the chart keeps the downside path active toward 4769 and then 4710.
The rebound is visible — but if this is truly wave 2, the more important move may still be lower.
Gold is moving into a very sensitive area where the current recovery still looks more corrective than impulsively bullish.
For Kelly, this matters because the chart is not reclaiming trend yet — it is only pushing back into a medium-term sell zone, which keeps the downside scenario active unless buyers can prove much more above current levels.
The political backdrop is also adding another layer of uncertainty. Resistance to Trump’s Fed-chair plan has increased in the Senate, and the standoff around Jerome Powell’s investigation is being framed as a question of Fed independence rather than only personnel. That keeps market uncertainty elevated heading into the week.
Technical structure
The chart still shows gold trapped inside a broader corrective framework, with price now testing the 4812 resistance band after a sharp rebound from lower levels.
This area matters for three reasons:
it is marked as the medium-term sell zone
price is still struggling to build acceptance above it
the structure beneath it continues to show weaker recovery quality rather than a clean breakout
Below current price, the technical map remains relatively clear:
4794 is the local pivot and immediate reaction line
4769 is the first confirmation level if weakness starts expanding again
4710 is the next high-liquidity support area and the first deeper downside objective
So technically, the current move still looks more like a retest into supply than the start of a new bullish leg.
Elliott structure
From an Elliott point of view, the chart is lining up more cleanly with a wave 2 rebound inside a broader bearish sequence.
That means the logic is straightforward:
the first downside leg has already been formed
the current recovery is retracing part of that decline
if resistance continues to hold, the next move could be the beginning of wave 3 lower
This is why the current zone is so important.
Wave 2 often looks convincing while it is unfolding, because price can recover sharply and retest overhead structure. But if that rebound begins to stall under supply, it usually means the market is not rebuilding trend — it is only correcting before the next directional leg.
For Kelly, the current chart fits that description well.
What matters next
The next read comes from how gold behaves around 4812 and then around 4769.
Bearish scenario
If price remains capped below the medium-term sell zone and starts slipping under 4769, then the wave-2 rebound is likely near completion.
That would make the path toward 4710 much more natural.
If 4710 also fails to hold, then the structure opens room for a deeper continuation lower.
Invalidation scenario
If buyers reclaim 4812 decisively and hold above it, then the bearish wave count loses quality.
That would delay the sell setup and suggest the market needs a broader re-evaluation.
Right now, however, price is still reacting under resistance — not breaking through it cleanly.
Macro backdrop
The macro side supports a cautious rather than aggressively bullish read.
Kevin Warsh’s nomination remains tied up in a Senate impasse, and there are still only weeks before Powell’s chair term ends, which adds uncertainty around how Fed leadership risk will be resolved.
For gold, that means volatility can stay elevated.
But for Kelly, volatility alone is not a signal. Structure still leads.
Kelly’s read
This is still a sell-the-wave-2 chart.
The rebound is visible, but it is happening into a mapped resistance zone and inside a broader defensive structure.
That keeps the downside scenario more attractive unless buyers can reclaim and hold above the current ceiling.
For Kelly, the cleaner approach is to let resistance decide.
As long as gold stays below 4812, the chart still leans toward another move lower, with 4769 as the first trigger and 4710 as the next key liquidity reference.
Conclusion
Gold is rebounding, but the recovery still looks corrective.
The Elliott structure on the chart suggests price may be finishing wave 2 inside a broader bearish sequence, while the 4812 resistance zone remains the key area where sellers can take control again.
As long as that zone holds, the chart keeps the downside path active toward 4769 and then 4710.
The rebound is visible — but if this is truly wave 2, the more important move may still be lower.
עסקה סגורה: היעד הושג
This is the correct script, guys, it's all going to create waves!

📌 New analysis published daily
🔔 Follow this profile for real-time updates
⚠️ This is personal analysis, not financial advice
Daily GOLD and Forex updates: t.me/+SOSI26CZOJ1mZDhl
🔔 Follow this profile for real-time updates
⚠️ This is personal analysis, not financial advice
Daily GOLD and Forex updates: t.me/+SOSI26CZOJ1mZDhl
פרסומים קשורים
כתב ויתור
המידע והפרסומים אינם מיועדים להיות, ואינם מהווים, ייעוץ או המלצה פיננסית, השקעתית, מסחרית או מכל סוג אחר המסופקת או מאושרת על ידי TradingView. קרא עוד ב־תנאי השימוש.
📌 New analysis published daily
🔔 Follow this profile for real-time updates
⚠️ This is personal analysis, not financial advice
Daily GOLD and Forex updates: t.me/+SOSI26CZOJ1mZDhl
🔔 Follow this profile for real-time updates
⚠️ This is personal analysis, not financial advice
Daily GOLD and Forex updates: t.me/+SOSI26CZOJ1mZDhl
פרסומים קשורים
כתב ויתור
המידע והפרסומים אינם מיועדים להיות, ואינם מהווים, ייעוץ או המלצה פיננסית, השקעתית, מסחרית או מכל סוג אחר המסופקת או מאושרת על ידי TradingView. קרא עוד ב־תנאי השימוש.