
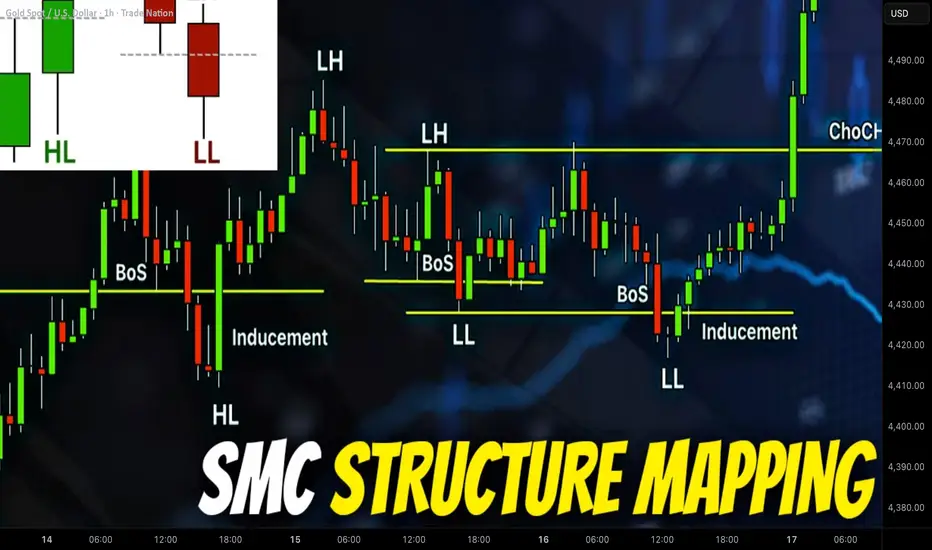
This article will teach you the absolute basics of Forex & Gold trading with Smart Money Concepts.
We will discuss SMC structure mapping and important events that are applied for making predictions, identifying trading entries and powerful confirmations with this advanced trading strategy.
Smart money traders perceive a price chart as a sequence of price movements: of impulse and retracement legs.
Each leg of a move has a direction, the initial, and completion points.
The initial and completion points of the price movements will have different names depending on their positioning and trend direction.
The legs of a price movement will have a different degree of significance.
The relations of initial and completion points of different impulses may mark critical events as, for example, a market reversal or trend continuation.
Here is how SMC trader perceives a price chart.
It is a pure sequence of price legs.
In order to start structure mapping, one should pick the initial point of analysis - usually it is a local bottom or top.
Our initial point of mapping will be a local bottom.
If the first leg of a move that you start the analysis with is bullish,
its initial point will be called the Initial Low.
If the first leg of a move that you start the analysis with is bearish,
its initial point will be called the Initial High.
The completion point of our first bullish movement will be called Higher High or HH.
After a completion of the first bullish movement, a bearish movement follows. The position of a completion point of this movement will determine its name.
If the movement completes with the range of a bullish movement,
its completion point will be called Higher Low.
If the movement completes below the range of a bullish movement,
its completion point will be called Lower Low.
In our case, we have a Higher Low.
When a new bullish movement initiates after a formation of a higher low, pay attention to a completion point of such a bullish movement.
If the price violates a level of a current high, the completion point of such a movement will be called a Higher High.
If the bullish movement completes below the level of a current high and a bearish movement follows, the completion point of such a movement will be called Lower High.
The sequence of 2 Higher Highs with a Higher Low between them confirms that the trend is bullish.
When the price violates a level of a current higher high or a current lower low, such an event is called Break of Structure or BoS.
Such an event is an important indicator of the strength of the buyers/sellers in Smart Money Concepts.
Here are the Break of Structures of Higher Highs
One more critical SMC event that we can recognize is Inducement.
With the Inducement, big players are grabbing the liquidity from the market participants, providing false bullish and bearish signals.
Each High in SMC is a potentially strong resistance.
Its bullish violation turns that into support from where buyers start placing orders, with a stop loss lying below that.
As the price is not respecting the broken structure, buyers start closing their long positions in loss - selling them and sellers start opening short positions.
Real intention of the big players was to buy huge volumes of an asset.
With the inducement, they made the crowd provide the liquidity for them.
A similar event may easily happen after a bearish breakout of a Low.
Above is the example of Inducement after a bullish breakout of a High.
Continuing the structure mapping, we can note a change of sentiment.
Analyzing bearish movements, we may recognize 2 important events.
In a bullish trend, a bearish violation of the level of the last higher low signifies a violation of a trend.
Such an event is called Change of Character (CHoCH).
Change of Character in a bearish trend, will be a bullish violation of the level of the last lower high. It will signify a bearish trend violation.
In our example, we can easily identify Change of Character, bullish trend violation and initiation of a bearish trend.
Here is how a complete structure mapping should look.
The rules that we discussed can be applied on any market and any time frame. However, the rule is that higher is the time frame, more reliable is the SMC structure mapping and more reliable signals it provides.
Study structure mapping with care, because it is a foundation of Smart Money Concepts.
❤️Please, support my work with like, thank you!❤️
I am part of Trade Nation's Influencer program and receive a monthly fee for using their TradingView charts in my analysis.
הערה
Check my new educational article: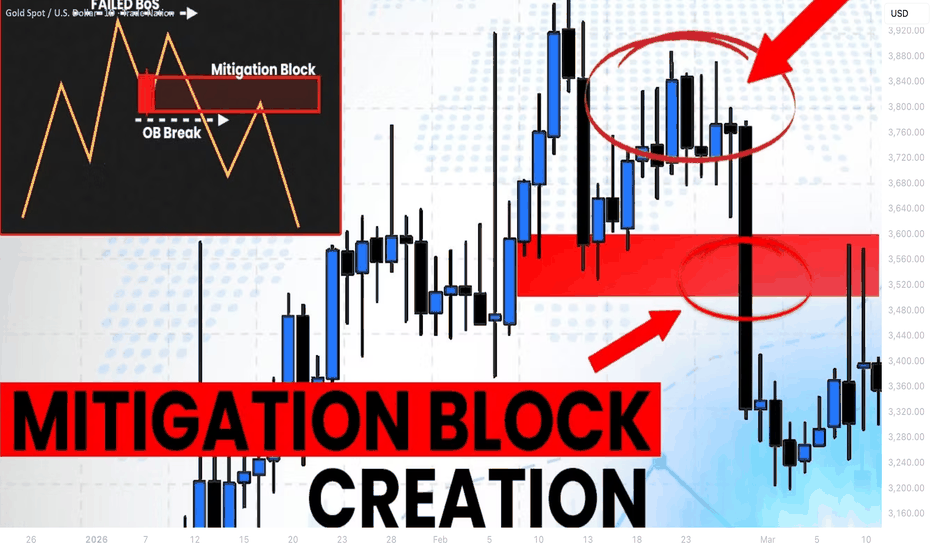

✅My Telegram Channel: t.me/VasilyTrading
❗️YouTube Channel: youtube.com/c/VasilyTrader
✅ Facebook: facebook.com/VasilyTrading/
⭐ Get 100% Deposit Bonus: bit.ly/bestforexgoldbroker
❗️YouTube Channel: youtube.com/c/VasilyTrader
✅ Facebook: facebook.com/VasilyTrading/
⭐ Get 100% Deposit Bonus: bit.ly/bestforexgoldbroker
פרסומים קשורים
כתב ויתור
המידע והפרסומים אינם מיועדים להיות, ואינם מהווים, ייעוץ או המלצה פיננסית, השקעתית, מסחרית או מכל סוג אחר המסופקת או מאושרת על ידי TradingView. קרא עוד ב־תנאי השימוש.
✅My Telegram Channel: t.me/VasilyTrading
❗️YouTube Channel: youtube.com/c/VasilyTrader
✅ Facebook: facebook.com/VasilyTrading/
⭐ Get 100% Deposit Bonus: bit.ly/bestforexgoldbroker
❗️YouTube Channel: youtube.com/c/VasilyTrader
✅ Facebook: facebook.com/VasilyTrading/
⭐ Get 100% Deposit Bonus: bit.ly/bestforexgoldbroker
פרסומים קשורים
כתב ויתור
המידע והפרסומים אינם מיועדים להיות, ואינם מהווים, ייעוץ או המלצה פיננסית, השקעתית, מסחרית או מכל סוג אחר המסופקת או מאושרת על ידי TradingView. קרא עוד ב־תנאי השימוש.