
1. Fundamental Context
New Record: Spot gold has hit an all-time high of $4,400 per ounce as of Monday.
Growth Drivers: This surge is propelled by expectations of further U.S. Federal Reserve rate cuts, sustained safe-haven demand due to geopolitical tensions, and a softer dollar.
Annual Performance: Gold is up 67% for the year, driven by robust central bank buying and trade tensions.
2. Technical Analysis (1h Chart)
Based on the technical indicators and Volume Profile:
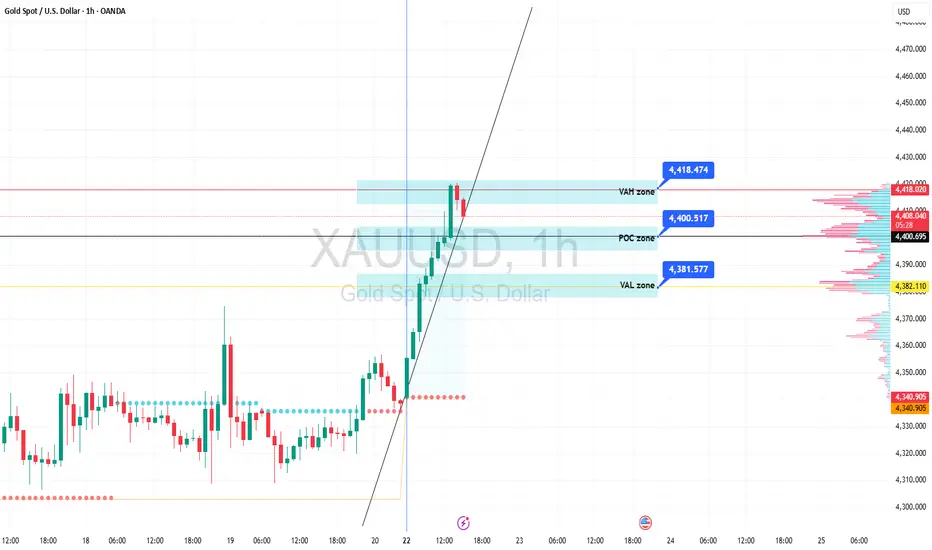
Trend Structure: The price is in a strong uptrend, hugging a very steep ascending trendline.
Key Value Areas:
VAH (Value Area High) - $4,418.474: This is the upper boundary of the value area, currently acting as immediate resistance.
POC (Point of Control) - $4,400.517: The level with the highest traded volume, aligning with the $4,400 psychological record, forming a very strong support zone.
VAL (Value Area Low) - $4,381.577: The lower boundary of the value area and the final support level to maintain the short-term bullish structure.
Market Flow: Institutional flow continues to control the market structure, with no signs of distribution or trend reversal.
3. Market Outlook & Scenarios
Continuation Scenario: Buy orders are being executed at pullback zones after the market completes expansion phases and sweeps liquidity. If the price closes firmly above the VAH ($4,418), Gold will likely continue its "price discovery" phase toward new highs.
Correction Scenario: Should a retracement occur, the POC ($4,400) zone will be the pivotal anchor. A pullback to this area is viewed as an opportunity for institutional investors to push prices higher within the sustained uptrend.
Summary: Gold remains extremely Bullish. The primary strategy is to monitor price action at the $4,400 POC zone to seek opportunities in line with the prevailing trend.
New Record: Spot gold has hit an all-time high of $4,400 per ounce as of Monday.
Growth Drivers: This surge is propelled by expectations of further U.S. Federal Reserve rate cuts, sustained safe-haven demand due to geopolitical tensions, and a softer dollar.
Annual Performance: Gold is up 67% for the year, driven by robust central bank buying and trade tensions.
2. Technical Analysis (1h Chart)
Based on the technical indicators and Volume Profile:
Trend Structure: The price is in a strong uptrend, hugging a very steep ascending trendline.
Key Value Areas:
VAH (Value Area High) - $4,418.474: This is the upper boundary of the value area, currently acting as immediate resistance.
POC (Point of Control) - $4,400.517: The level with the highest traded volume, aligning with the $4,400 psychological record, forming a very strong support zone.
VAL (Value Area Low) - $4,381.577: The lower boundary of the value area and the final support level to maintain the short-term bullish structure.
Market Flow: Institutional flow continues to control the market structure, with no signs of distribution or trend reversal.
3. Market Outlook & Scenarios
Continuation Scenario: Buy orders are being executed at pullback zones after the market completes expansion phases and sweeps liquidity. If the price closes firmly above the VAH ($4,418), Gold will likely continue its "price discovery" phase toward new highs.
Correction Scenario: Should a retracement occur, the POC ($4,400) zone will be the pivotal anchor. A pullback to this area is viewed as an opportunity for institutional investors to push prices higher within the sustained uptrend.
Summary: Gold remains extremely Bullish. The primary strategy is to monitor price action at the $4,400 POC zone to seek opportunities in line with the prevailing trend.

פרסומים קשורים
כתב ויתור
המידע והפרסומים אינם מיועדים להיות, ואינם מהווים, ייעוץ או המלצה פיננסית, השקעתית, מסחרית או מכל סוג אחר המסופקת או מאושרת על ידי TradingView. קרא עוד ב־תנאי השימוש.
פרסומים קשורים
כתב ויתור
המידע והפרסומים אינם מיועדים להיות, ואינם מהווים, ייעוץ או המלצה פיננסית, השקעתית, מסחרית או מכל סוג אחר המסופקת או מאושרת על ידי TradingView. קרא עוד ב־תנאי השימוש.