
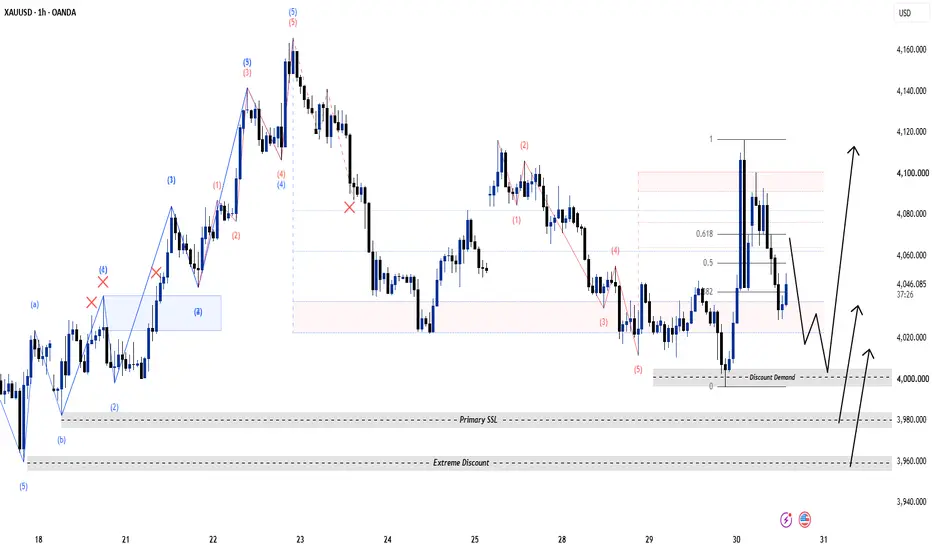
Gold is trading around $4,047, after the FOMC kept rates unchanged. The market is now shifting attention toward US Q2 GDP and June PCE, keeping volatility elevated. Gold initially reacted positively to the Fed decision, while the dollar eased, but the inflation data could still reshape rate expectations.
H1 Structure
The chart shows a clear bullish recovery from the $3,960–$3,980 discount area.
H1 impulsive leg remains constructive.
Price is currently retracing from the $4,100–$4,115 premium area.
Fibonacci retracement places the key reaction zones around:
0.382: ~$4,020
0.5: ~$4,040
0.618: ~$4,060
The $4,000 psychological level remains the major liquidity/demand zone.
Deeper demand sits around $3,960–$3,980.
Key Zones
Resistance / BSL
$4,075–$4,100
$4,115–$4,120
Retracement / Reaction
$4,040–$4,050
$4,020–$4,030
Major Demand
$4,000–$4,005
$3,960–$3,980
🧠 IF–THEN Playbook
IF Gold holds $4,020–$4,040 and prints bullish CHoCH/MSS on M15 →
THEN look for continuation toward $4,075 → $4,100 → $4,115.
IF price sweeps $4,000–$4,005 and quickly reclaims the level →
THEN the deeper liquidity grab could become the higher-quality long setup.
IF H1 closes decisively below $3,960 →
THEN the bullish recovery structure is invalidated.
Are we seeing a healthy H1 retracement — or the start of another $4,000 liquidity sweep?
H1 Structure
The chart shows a clear bullish recovery from the $3,960–$3,980 discount area.
H1 impulsive leg remains constructive.
Price is currently retracing from the $4,100–$4,115 premium area.
Fibonacci retracement places the key reaction zones around:
0.382: ~$4,020
0.5: ~$4,040
0.618: ~$4,060
The $4,000 psychological level remains the major liquidity/demand zone.
Deeper demand sits around $3,960–$3,980.
Key Zones
Resistance / BSL
$4,075–$4,100
$4,115–$4,120
Retracement / Reaction
$4,040–$4,050
$4,020–$4,030
Major Demand
$4,000–$4,005
$3,960–$3,980
🧠 IF–THEN Playbook
IF Gold holds $4,020–$4,040 and prints bullish CHoCH/MSS on M15 →
THEN look for continuation toward $4,075 → $4,100 → $4,115.
IF price sweeps $4,000–$4,005 and quickly reclaims the level →
THEN the deeper liquidity grab could become the higher-quality long setup.
IF H1 closes decisively below $3,960 →
THEN the bullish recovery structure is invalidated.
Are we seeing a healthy H1 retracement — or the start of another $4,000 liquidity sweep?
עסקה סגורה: היעד הושג
+816 pips - Gold is waiting for the monthly candle to close, awaiting confirmation today.

כתב ויתור
המידע והפרסומים אינם מיועדים להיות, ואינם מהווים, ייעוץ או המלצה פיננסית, השקעתית, מסחרית או מכל סוג אחר המסופקת או מאושרת על ידי TradingView. קרא עוד ב־תנאי השימוש.
כתב ויתור
המידע והפרסומים אינם מיועדים להיות, ואינם מהווים, ייעוץ או המלצה פיננסית, השקעתית, מסחרית או מכל סוג אחר המסופקת או מאושרת על ידי TradingView. קרא עוד ב־תנאי השימוש.