
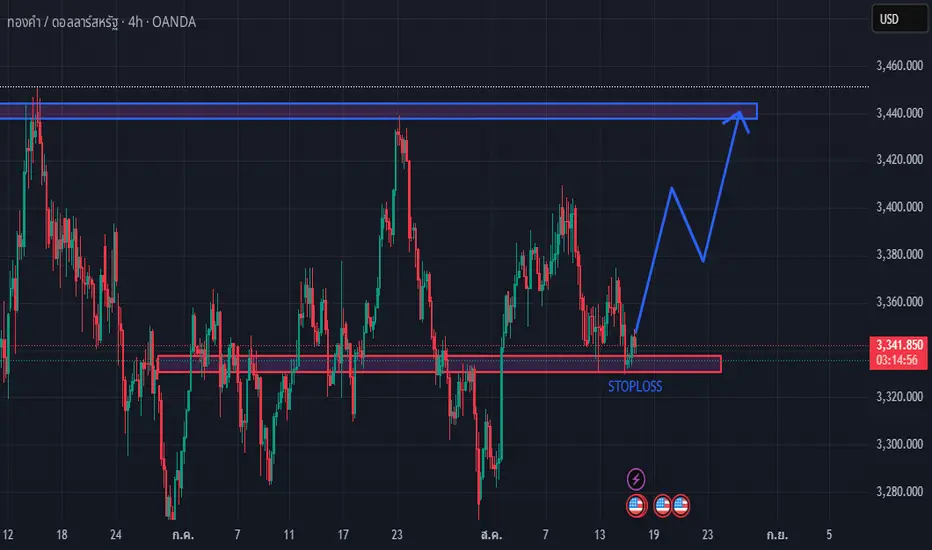
1. Support Zone
Marked in red, around 3340 – 3345.
This level has acted as a strong rebound point multiple times in the past → expected to continue serving as support.
2. Resistance Zone
Marked in blue, around 3430 – 3435.
This is a previous high where price faced strong selling pressure → the main take-profit target.
3. Price Scenario
Price is currently near the red support zone → expected to bounce.
The blue arrow suggests the following movement:
Bounce from support
Small pullback/correction
Continue rising toward the 3430 – 3435 resistance zone
4. Stop-Loss
Placed below the support zone (labeled “STOPLOSS” on the chart), around below 3340.
5. Strategy Implication
This is a buy-at-support setup, with take-profit at resistance and stop-loss below support.
The risk-to-reward ratio is relatively favorable, as the stop-loss range is short compared to the target profit.
Marked in red, around 3340 – 3345.
This level has acted as a strong rebound point multiple times in the past → expected to continue serving as support.
2. Resistance Zone
Marked in blue, around 3430 – 3435.
This is a previous high where price faced strong selling pressure → the main take-profit target.
3. Price Scenario
Price is currently near the red support zone → expected to bounce.
The blue arrow suggests the following movement:
Bounce from support
Small pullback/correction
Continue rising toward the 3430 – 3435 resistance zone
4. Stop-Loss
Placed below the support zone (labeled “STOPLOSS” on the chart), around below 3340.
5. Strategy Implication
This is a buy-at-support setup, with take-profit at resistance and stop-loss below support.
The risk-to-reward ratio is relatively favorable, as the stop-loss range is short compared to the target profit.

כתב ויתור
המידע והפרסומים אינם מיועדים להיות, ואינם מהווים, ייעוץ או המלצה פיננסית, השקעתית, מסחרית או מכל סוג אחר המסופקת או מאושרת על ידי TradingView. קרא עוד ב־תנאי השימוש.
כתב ויתור
המידע והפרסומים אינם מיועדים להיות, ואינם מהווים, ייעוץ או המלצה פיננסית, השקעתית, מסחרית או מכל סוג אחר המסופקת או מאושרת על ידי TradingView. קרא עוד ב־תנאי השימוש.