
If you ask any professional trader about the most simple yet powerful tool in trading, many of them will say the same thing:
Trendlines.
No complex indicators.
No complicated systems.
Just one properly drawn line can help you:
- Identify the market trend
- Find high-probability entry points
- Avoid fake breakouts
- Understand market psychology
But the truth is, most traders draw trendlines incorrectly, which often leads to getting stopped out again and again.
This article will help you understand how professional traders actually draw and use trendlines.
1. How Trendlines Actually Work
A trendline is simply a line connecting key highs or lows in the market to reveal the direction of price movement.
There are two main types:
Uptrend Line
- Connect higher lows
- Price often bounces when it touches the trendline
Downtrend Line
- Connect lower highs
- Price often gets rejected when it touches the trendline
Trendlines work because they reflect market psychology.
Large traders and institutions often:
- buy near trendline support
- sell near trendline resistance
2. The Golden Rule of Drawing Trendlines
A valid trendline needs at least two touches, but three touches confirm its strength.
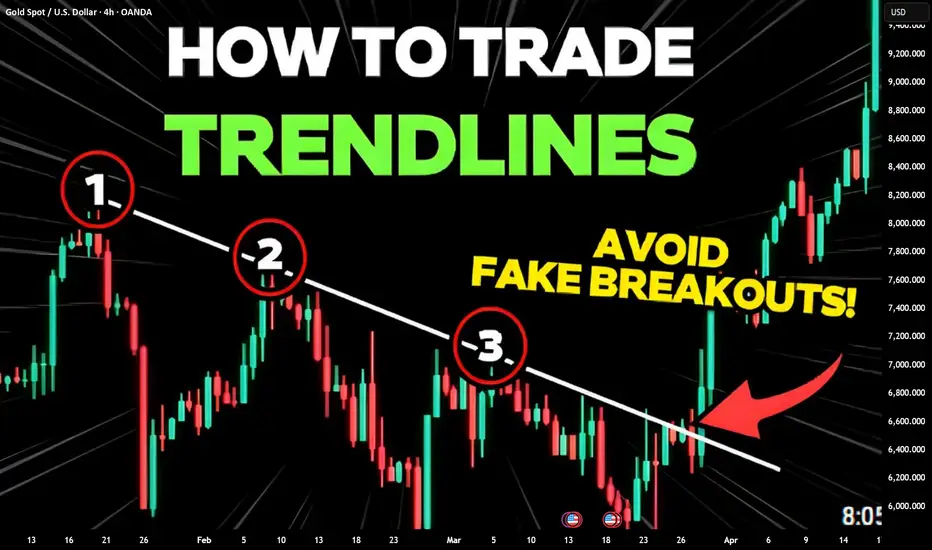
As shown in the image:
1️⃣ First touch – creates the initial high
2️⃣ Second touch – confirms the trend
3️⃣ Third touch – the trendline becomes reliable
After the third touch, the market often:
- reacts more strongly
- attracts more trader attention
- creates higher-probability trading setups
That’s why the third test of a trendline is often the best setup.
3. The Biggest Mistake Traders Make
The most common mistake is:
❌ Forcing a trendline to fit the price
Many traders stretch their lines just to touch as many candles as possible, which removes the real meaning of the trend.
Important principles:
✔ Trendlines should naturally touch candle wicks or bodies
✔ Avoid cutting through too many candles
✔ The line should look natural and clean
Always let the market draw the trendline — not you.
4. How to Avoid Fake Breakouts
Fake breakouts are one of the most common traps in the market.
A typical scenario looks like this:
1️⃣ Price breaks the trendline
2️⃣ Traders enter a breakout trade
3️⃣ Price reverses sharply → stop losses get triggered
To avoid this trap, remember these three rules:
1. Wait for the candle to close
Never trade a breakout when price just pokes through the trendline.
Wait for a clear candle close beyond the line.
2. Wait for the retest
Strong breakouts usually follow this pattern:
Break → Retest → Move
The retest is often the lowest-risk entry opportunity.
3. Watch the momentum
Real breakouts usually come with:
- strong candles
- high momentum
- small wicks
Weak breakouts often turn into fakeouts.
5. A Simple Trendline Strategy
One of the most popular setups is the:
Trendline Bounce Strategy
Conditions:
- A clear trend
- A trendline with at least three touches
Entry:
- when price returns to the trendline
- and shows reversal price action
Stop Loss:
- below the most recent swing low
Take Profit:
- at the previous resistance zone
This strategy is widely used by experienced traders because it offers:
✔ Low risk
✔ Good risk-to-reward
✔ Clear and simple structure
6. Something Most Beginners Don’t Realize
A trendline is not an exact line.
Think of it more like a zone rather than a razor-thin line.
Price can:
- slightly break it
- wick through it
- and still continue in the original trend
This behavior is completely normal.
Professional traders don’t panic when price slightly pierces a trendline.
Final Thoughts
Trendlines are one of the most powerful tools in trading, despite their simplicity.
But they only work well if you:
✔ draw them based on real market structure
✔ wait for confirmation
✔ avoid emotional breakout trades
Remember:
Winning traders don’t rely on complicated indicators.
They rely on understanding how the market moves.
And sometimes…
all it takes is one perfectly drawn line.
🔥 If you found this idea helpful, drop a Like and follow for more practical trading insights!
Trendlines.
No complex indicators.
No complicated systems.
Just one properly drawn line can help you:
- Identify the market trend
- Find high-probability entry points
- Avoid fake breakouts
- Understand market psychology
But the truth is, most traders draw trendlines incorrectly, which often leads to getting stopped out again and again.
This article will help you understand how professional traders actually draw and use trendlines.
1. How Trendlines Actually Work
A trendline is simply a line connecting key highs or lows in the market to reveal the direction of price movement.
There are two main types:
Uptrend Line
- Connect higher lows
- Price often bounces when it touches the trendline
Downtrend Line
- Connect lower highs
- Price often gets rejected when it touches the trendline
Trendlines work because they reflect market psychology.
Large traders and institutions often:
- buy near trendline support
- sell near trendline resistance
2. The Golden Rule of Drawing Trendlines
A valid trendline needs at least two touches, but three touches confirm its strength.
As shown in the image:
1️⃣ First touch – creates the initial high
2️⃣ Second touch – confirms the trend
3️⃣ Third touch – the trendline becomes reliable
After the third touch, the market often:
- reacts more strongly
- attracts more trader attention
- creates higher-probability trading setups
That’s why the third test of a trendline is often the best setup.
3. The Biggest Mistake Traders Make
The most common mistake is:
❌ Forcing a trendline to fit the price
Many traders stretch their lines just to touch as many candles as possible, which removes the real meaning of the trend.
Important principles:
✔ Trendlines should naturally touch candle wicks or bodies
✔ Avoid cutting through too many candles
✔ The line should look natural and clean
Always let the market draw the trendline — not you.
4. How to Avoid Fake Breakouts
Fake breakouts are one of the most common traps in the market.
A typical scenario looks like this:
1️⃣ Price breaks the trendline
2️⃣ Traders enter a breakout trade
3️⃣ Price reverses sharply → stop losses get triggered
To avoid this trap, remember these three rules:
1. Wait for the candle to close
Never trade a breakout when price just pokes through the trendline.
Wait for a clear candle close beyond the line.
2. Wait for the retest
Strong breakouts usually follow this pattern:
Break → Retest → Move
The retest is often the lowest-risk entry opportunity.
3. Watch the momentum
Real breakouts usually come with:
- strong candles
- high momentum
- small wicks
Weak breakouts often turn into fakeouts.
5. A Simple Trendline Strategy
One of the most popular setups is the:
Trendline Bounce Strategy
Conditions:
- A clear trend
- A trendline with at least three touches
Entry:
- when price returns to the trendline
- and shows reversal price action
Stop Loss:
- below the most recent swing low
Take Profit:
- at the previous resistance zone
This strategy is widely used by experienced traders because it offers:
✔ Low risk
✔ Good risk-to-reward
✔ Clear and simple structure
6. Something Most Beginners Don’t Realize
A trendline is not an exact line.
Think of it more like a zone rather than a razor-thin line.
Price can:
- slightly break it
- wick through it
- and still continue in the original trend
This behavior is completely normal.
Professional traders don’t panic when price slightly pierces a trendline.
Final Thoughts
Trendlines are one of the most powerful tools in trading, despite their simplicity.
But they only work well if you:
✔ draw them based on real market structure
✔ wait for confirmation
✔ avoid emotional breakout trades
Remember:
Winning traders don’t rely on complicated indicators.
They rely on understanding how the market moves.
And sometimes…
all it takes is one perfectly drawn line.
🔥 If you found this idea helpful, drop a Like and follow for more practical trading insights!
הערה
Good luck 
פרסומים קשורים
כתב ויתור
המידע והפרסומים אינם מיועדים להיות, ואינם מהווים, ייעוץ או המלצה פיננסית, השקעתית, מסחרית או מכל סוג אחר המסופקת או מאושרת על ידי TradingView. קרא עוד ב־תנאי השימוש.
כתב ויתור
המידע והפרסומים אינם מיועדים להיות, ואינם מהווים, ייעוץ או המלצה פיננסית, השקעתית, מסחרית או מכל סוג אחר המסופקת או מאושרת על ידי TradingView. קרא עוד ב־תנאי השימוש.