
Gold (XAUUSD) Weekly Technical Analysis
Bias: Bounce Phase / Broader Downtrend Context
CMP: 4,829.31 (as on 17 Apr 2026)
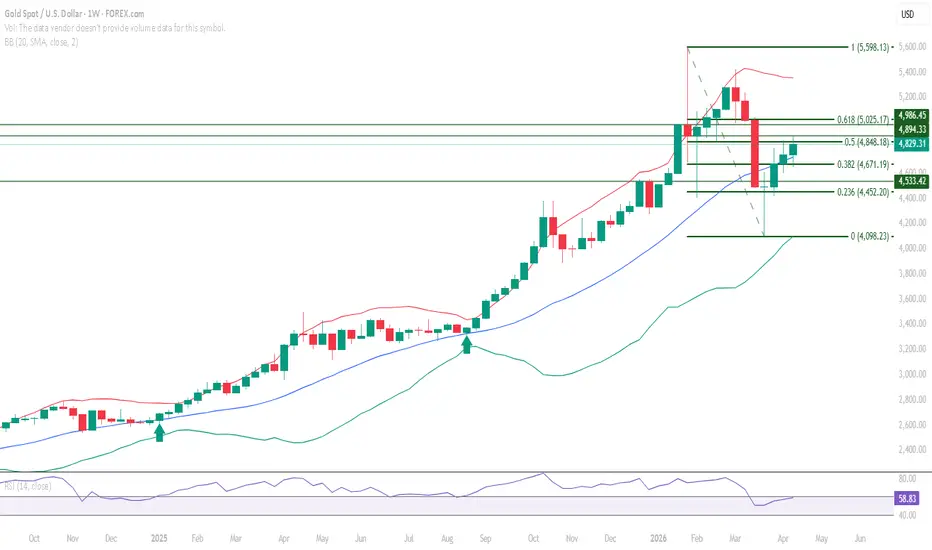
After a sharp recovery from the 4,098 base, Gold (XAUUSD) is pressing directly into the Fibonacci 0.50 zone — the level where the market decides whether this bounce becomes continuation or fades back into the broader downtrend. The next few weekly candles here carry significant structural weight.
Price Structure
The weekly chart reflects a recovery from the 4,098.23 base. Price has reclaimed and held above the Fibonacci 0.382 (4,671.19) and the Mid Bollinger Band (4,725.57), establishing both as confirmed structural support. The current week opens with price approaching the Fibonacci 0.50 resistance at 4,848.18, with the key structural level at 4,894.33 just above. This compressed zone is where the structure’s next phase gets defined.
Momentum Check
RSI is at 58.83, approaching the 60 level from below. Sustaining above 60 would indicate improving short-term momentum and a potential shift in the broader momentum structure. During the recent pullback phase, RSI 40 held as momentum support — a constructive signal. Bollinger Bands show price holding above the Mid Band (4,725.57), which serves as the nearest dynamic support.
Note: Volume data is not available for this instrument through the current data provider.
Key Levels
Resistance:
4,848.18 — Immediate Resistance (Fibonacci 0.50)
4,894.33 — Key Resistance
4,986.45 — Major Resistance
5,025.17 — Strong Resistance (Fibonacci 0.618)
Support:
4,725.57 — Immediate Support (Mid Bollinger Band)
4,671.19 — Key Support (Fibonacci 0.382)
4,533.42 — Major Support
4,452.20 — Strong Support (Fibonacci 0.236)
Structure Context
The broader downtrend from January 2026 highs remains the dominant structural context. The current bounce from the 4,098 base has established early signs of higher highs and higher lows within this context. Sustaining above the Fibonacci 0.50 zone and the 4,894.33 resistance would be required to materially shift the structural picture. This is where that question gets answered.
The Fibonacci 0.50 level at 4,848.18 and the 4,894.33 key resistance are now only a few points apart. Which of these two zones are you treating as the more significant test for the current structure — and what evidence would you want to see to call it a confirmation?
XAUUSD, Gold, GoldAnalysis, TechnicalAnalysis, PreciousMetals, ChartAnalysis, MarketStructure, WeeklyAnalysis
This analysis is educational technical chart analysis provided for informational purposes only. It does not constitute investment advice or any recommendation to buy, sell, or hold any financial instrument. All analysis is based on publicly available market data and is subject to change. Users are solely responsible for their own investment and trading decisions.
Bias: Bounce Phase / Broader Downtrend Context
CMP: 4,829.31 (as on 17 Apr 2026)
After a sharp recovery from the 4,098 base, Gold (XAUUSD) is pressing directly into the Fibonacci 0.50 zone — the level where the market decides whether this bounce becomes continuation or fades back into the broader downtrend. The next few weekly candles here carry significant structural weight.
Price Structure
The weekly chart reflects a recovery from the 4,098.23 base. Price has reclaimed and held above the Fibonacci 0.382 (4,671.19) and the Mid Bollinger Band (4,725.57), establishing both as confirmed structural support. The current week opens with price approaching the Fibonacci 0.50 resistance at 4,848.18, with the key structural level at 4,894.33 just above. This compressed zone is where the structure’s next phase gets defined.
Momentum Check
RSI is at 58.83, approaching the 60 level from below. Sustaining above 60 would indicate improving short-term momentum and a potential shift in the broader momentum structure. During the recent pullback phase, RSI 40 held as momentum support — a constructive signal. Bollinger Bands show price holding above the Mid Band (4,725.57), which serves as the nearest dynamic support.
Note: Volume data is not available for this instrument through the current data provider.
Key Levels
Resistance:
4,848.18 — Immediate Resistance (Fibonacci 0.50)
4,894.33 — Key Resistance
4,986.45 — Major Resistance
5,025.17 — Strong Resistance (Fibonacci 0.618)
Support:
4,725.57 — Immediate Support (Mid Bollinger Band)
4,671.19 — Key Support (Fibonacci 0.382)
4,533.42 — Major Support
4,452.20 — Strong Support (Fibonacci 0.236)
Structure Context
The broader downtrend from January 2026 highs remains the dominant structural context. The current bounce from the 4,098 base has established early signs of higher highs and higher lows within this context. Sustaining above the Fibonacci 0.50 zone and the 4,894.33 resistance would be required to materially shift the structural picture. This is where that question gets answered.
The Fibonacci 0.50 level at 4,848.18 and the 4,894.33 key resistance are now only a few points apart. Which of these two zones are you treating as the more significant test for the current structure — and what evidence would you want to see to call it a confirmation?
XAUUSD, Gold, GoldAnalysis, TechnicalAnalysis, PreciousMetals, ChartAnalysis, MarketStructure, WeeklyAnalysis
This analysis is educational technical chart analysis provided for informational purposes only. It does not constitute investment advice or any recommendation to buy, sell, or hold any financial instrument. All analysis is based on publicly available market data and is subject to change. Users are solely responsible for their own investment and trading decisions.

כתב ויתור
המידע והפרסומים אינם מיועדים להיות, ואינם מהווים, ייעוץ או המלצה פיננסית, השקעתית, מסחרית או מכל סוג אחר המסופקת או מאושרת על ידי TradingView. קרא עוד ב־תנאי השימוש.
כתב ויתור
המידע והפרסומים אינם מיועדים להיות, ואינם מהווים, ייעוץ או המלצה פיננסית, השקעתית, מסחרית או מכל סוג אחר המסופקת או מאושרת על ידי TradingView. קרא עוד ב־תנאי השימוש.