
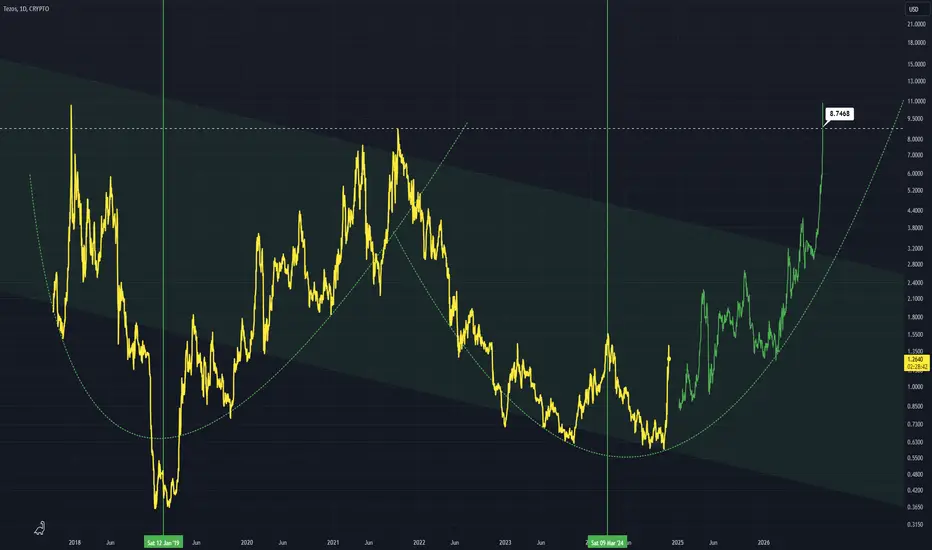
Although a large down channel can be plotted an overarching W pattern can be observed with highs at the dashed white line
Right now XTZ is moving from a bear market into a bull one
I see a pump up to about ~$8
The vertical lines show the point where the shift from bear to bull occurs
Daily chart
Right now XTZ is moving from a bear market into a bull one
I see a pump up to about ~$8
The vertical lines show the point where the shift from bear to bull occurs
Daily chart

כתב ויתור
המידע והפרסומים אינם מיועדים להיות, ואינם מהווים, ייעוץ או המלצה פיננסית, השקעתית, מסחרית או מכל סוג אחר המסופקת או מאושרת על ידי TradingView. קרא עוד ב־תנאי השימוש.
כתב ויתור
המידע והפרסומים אינם מיועדים להיות, ואינם מהווים, ייעוץ או המלצה פיננסית, השקעתית, מסחרית או מכל סוג אחר המסופקת או מאושרת על ידי TradingView. קרא עוד ב־תנאי השימוש.