
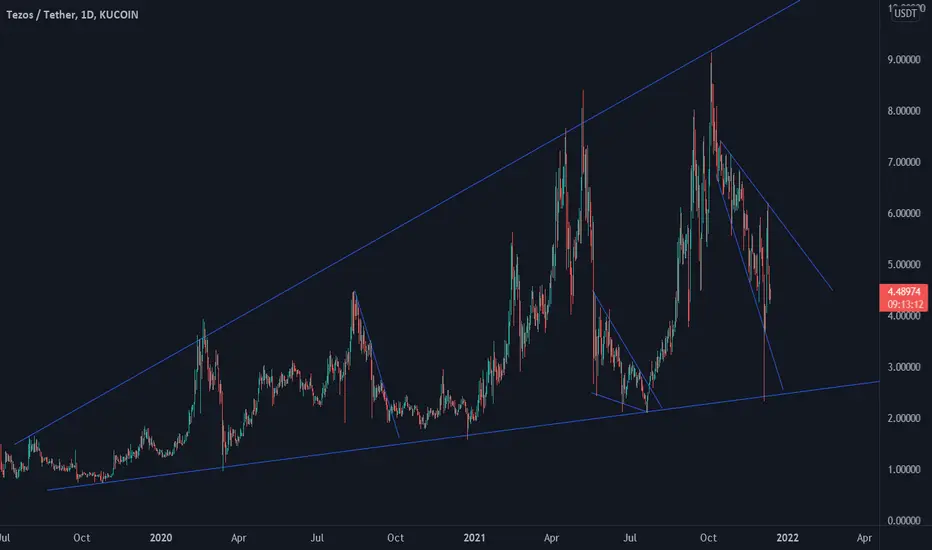
If zoom out, we can see that the Tezos is moving in an inverted wedge/triangle pattern. There are support and resistance lines/areas which when the price reaches, will bounce off it. Currently, XTZ is moving down, also in an inverted wedge/triangle. The best area to buy is when the price reaches the area near the bottom of the pattern.

כתב ויתור
המידע והפרסומים אינם מיועדים להיות, ואינם מהווים, ייעוץ או המלצה פיננסית, השקעתית, מסחרית או מכל סוג אחר המסופקת או מאושרת על ידי TradingView. קרא עוד ב־תנאי השימוש.
כתב ויתור
המידע והפרסומים אינם מיועדים להיות, ואינם מהווים, ייעוץ או המלצה פיננסית, השקעתית, מסחרית או מכל סוג אחר המסופקת או מאושרת על ידי TradingView. קרא עוד ב־תנאי השימוש.