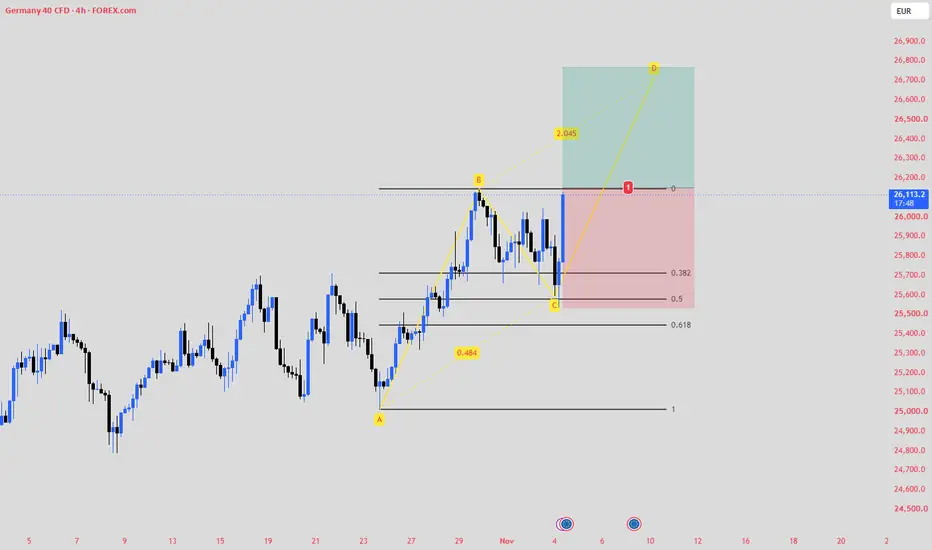
(GER40) – 4H Bullish ABCD PatternGermany 40 is developing a potential bullish ABCD harmonic structure on the 4H timeframe. Price established a strong bullish impulse from point A (around 25,000) to point B (around 26,125), followed by a corrective move towards point C.
The correction reached the 0.5 Fibonacci retracement level, within the golden pocket area (0.382–0.5), where price showed signs of bullish rejection. This retracement provides a potential foundation for the next bullish leg.
Technical Analysis
ABCD Pattern:
AB=CD
ZROUSDT 1H | Bullish Divergence + Fibonacci Golden Zone# ZRO | Bullish Divergence + Fibonacci Golden Zone – Potential Long Opportunity
## Market Outlook
#ZRO is approaching an interesting potential buying zone on the 1-hour timeframe, where multiple technical factors are aligning to create a possible bullish reversal opportunity.
Price is currently trading around a key horizontal support level while forming a potential bullish divergence on the RSI. Additionally, the price is positioned within the Fibonacci Golden Zone (0.5–0.618), an area that t
Gold (XAUUSD)Gold has reached the lower boundary of its descending channel, completing a well-structured and highly symmetrical AB=CD pattern.
Although my overall outlook remains bearish and I still expect further downside, a short-term bullish correction could develop from this area.
This potential rebound may provide an attractive counter-trend buying opportunity, allowing us to take advantage of the upward correction before the broader downtrend potentially resumes.
GBPUSD Possible SenarionFX_IDC:GBPUSD GBP/USD | Bullish Channel – AB=CD Pattern
On the GBP/USD chart, we can clearly identify a well-defined ascending channel. An AB=CD harmonic pattern has also formed, and price has shown a strong positive reaction at the lower boundary of the channel, aligning with the completion of the pattern at point D. Following this reaction, price has started moving upward.
Currently, price is approaching a resistance zone. Therefore, we may expect a short-term correction, potentially follow
Ethereum (ETH) – Long-Term Elliott Wave Analysis | Two PotentialIn this analysis, I have intentionally left out the historical portion of the chart to keep the focus on the potential future wave structure. However, the red ABCD labeling represents the larger-degree, long-term wave structure.
Considering the current conditions in the cryptocurrency market and the price action visible on the chart, it appears that a five-wave structure has already been completed.
Ethereum now seems to be moving through a higher-degree corrective phase, potentially forming a
Be careful, Gold may fall to 3500Be careful, Gold may fall to 3500
The VAL is at 3980
If price drop below this level,
bearish wave confirmed.
the fib ext 1.618 is 3478
So we can find bearish pattern
to Sell gold
such as Bearish Inside Bar,
Bearish engufling
Bearish Pin bar
in 4H and 1H chart.
Good luck!
TRXUSDT Daily – ABCD Harmonic Setup (2x 100% Backtest) TRXUSDT Daily – ABCD Harmonic Setup (2x 100% Backtest) + 50/200 MA Cross in Low-Volume Regime
TRX has delivered two clean ABCD harmonic completions on the daily timeframe, both of which resolved exactly as expected (100% hit rate on the backtest).
Historical ABCD setups (visible on chart):
Mid-2024 ABCD (0.791 BC / 1.353 CD) → full target hit.
Early-2026 ABCD (0.979 BC / 0.936 CD) → full target hit.
Current structure:
Price is now completing a third ABCD in the same low-volume environment.
Eth AB=CD and strong bullish divergence showing on chartCOINBASE:ETHUSD confirmed an AB=CD bearish exhaustion pattern where the time of A-B equals the time of B-C with a strong trend reversal shown by divergence on the cumulative volume delta and relative strength index our target price is point A on the chart and my entry and stop is shown for this first leg on chart as well. Divergence for those that do not know is when price structure on chart is in an up or down trend but readings on indicators show opposing signs. This is strong indication of a
BTC IS HEADING TO 75K!Based on Elliot Wave analysis, 5 impulse waves have been completed.
The top of 5 confirmed with bearish divergence on MACD.
The A correction can be 3 or (possible) 5 also has been completed.
NOW.. IT'S B, should target around 82,500 to 85,500.
I WILL SELL ON B TO ENJOY THE NEXT C CORRECTION..
SELL: 83,000 to 85,000
TP: 72,000 to 75,000
SL: ABOVE TOP OF (5)
CHEERRRSSS....!!!
The $1035 Breakout: MU's Golden Pocket Bounce Isn't DoneStory:
📊 The Pattern
MU carved out a cup and handle after topping near its prior high at 1254. The cup's low lined up almost exactly with the golden pocket retracement of the prior rally, and price bounced hard from that zone, built a handle, and is now breaking out.
⚡ The Confirmation
Last candle broke above the handle resistance, and volume started rising over the last few days.
🎯 Levels to Watch
🟢 Support: bullish while holding above $1030 should act as support now. But a deeper pullback c
XRP 1W ABCD Pattern: Point D Zone Reached, Measured Move Eyes on xrp $182–$2.05
XRP has printed a clear ABCD structure on the weekly chart. Point A sits near the $1.55–$1.60 area, B forms the low around $1.00, C prints the swing high near $1.72–$1.75, and D is completing in the $1.42–$1.49 demand zone (current close $1.4941). The CD leg is descending into a tightening structure that resembles a falling wedge / descending triangle hybrid inside the larger ABCD.
Price has already cleared the immediate reaction low and is holding above $1.49 after this
AADX – Potential Bullish ABCD ReversalAADX is approaching an interesting technical area on the daily chart, where a potential bullish ABCD-style reversal is developing.
The decline from point C to point D has extended beyond the length of the original AB leg, suggesting an extended harmonic structure rather than a traditional equal-leg ABCD pattern.
What catches my attention is the potential reversal area around $11.00–$11.50. Price has been consolidating near this zone after a prolonged decline, potentially setting the stage for
NASDAQ TRADE UPDATE: What Happens After the First Reaction?In today’s trading walkthrough, I’m revisiting the bullish Nasdaq idea I shared yesterday and breaking down what happened after price reached our key level.
Price did react exactly where we anticipated, but we never got the full follow-through we were looking for. Now, as price returns to retest our original entry area, we need to start thinking about how the trade could develop from here.
Could this turn into a complex pullback? Is a Gartley pattern beginning to form? And more importantly, ho
USDCHF | 4H Bullish AB=CD Pattern#USDCHF continues to respect a clear 4H uptrend, and price is currently developing a potential AB=CD bullish harmonic structure.
So far, the chart is not showing a clear bearish reversal signal, keeping the bullish structure intact.
Trade Idea:
Long from CMP
Target: Based on the AB=CD completion / next resistance
Stop Loss: Below the relevant 4H structure
Risk Management: Maintain a controlled risk-to-reward ratio
The key is to see whether price continues to respect the bullish structure and
GBPUSD — Bullish Divergence | Bearish Flag Reversal BreakoutGBPUSD 4H: Price remains in a bearish trend, but a bullish RSI divergence has formed as downside momentum weakens near the recent lows. Price has also developed a bearish flag/channel structure, creating a potential reversal setup if the upper trendline is broken. The trade is to buy only after a confirmed breakout above 1.34101, targeting TP1 at 1.35017 and TP2 at 1.35922, with Stop Loss at 1.33179 below the recent low. The combination of bullish divergence and a breakout from the bearish flag
NZD/USD Official Trading PlanNZD/USD Official Trading Plan
1. Trading Instrument
Trading Instrument: NZD/USD
2. Analysis Timeframe
Analysis Timeframe: 2H Band Trading
3. Entry Level
Go long near the market price at 0.57541
4. Stop Loss Level
Full position stop loss placed at 0.57380.
Strictly execute stop loss once the price breaks the stop loss level, no holding and no subjective adjustment. This trade is configured with a fixed risk-reward ratio of 1:16.
5. Take Profit & Risk Protection Rules
1. First Target: 0.
AUD/USD Official Trading PlanAUD/USD Official Trading Plan
1. Trading Instrument
Trading Instrument: AUD/USD
2. Analysis Timeframe
Analysis Timeframe: 2H Band Trading
3. Entry Level
Go long near the market price at 0.771275
4. Stop Loss Level
Full position stop loss placed at 0.71180.
Strictly execute stop loss once the price breaks the stop loss level, no holding and no subjective adjustment.
5. Take Profit & Risk Protection Rules
1. First Target: 0.71700
Reduce half of the position, move stop loss forward to loc
EUR/USD 2H Long Trading PlanEUR/USD 2H Long Trading Plan
Timeframe: 2H
Direction: Long
Entry: 1.15359
Stop Loss: 1.15310
Profit Targets & Position Management:
1. TP1 1.15925: Reduce half position, trail stop loss.
2. TP2 1.16384: Reduce half of remaining position, trail stop loss.
3. TP3 1.16982: Reduce half of remaining position, trail stop loss.
Remaining small position: Use trailing stop to let profit run.
Disclaimer
This trading plan is for educational purposes only and does not constitute investment advice.
#GBPJPY: Up To +5000 Pips To Grab; Will It Drop? 🔺GBPJPY is approaching a significant weekly resistance area after an extended bullish run. At the time of this chart, the price is trading around 216.708, just below the proposed swing-selling region between 217.694 and 223.406.
For retail traders, this zone indicates a potential reversal but does not warrant immediate selling.
🔺The chart suggests that the weekly trend remains bullish. Price has consistently formed higher highs, higher lows and several bullish breaks of structure. This indic
GOLD H4 — Stay Neutral!After several bullish weeks, gold is now making a correction. At the current level, it is better to stay neutral because the market is not in a good position for either buying or selling. However, I believe the buy side has better potential.
For a short trade, it may be better to wait for Wave c of B to complete, possibly around $4,600. After that, another Wave C should complete the ABC correction.
If the ABC correction finishes around $4,250, there may be a good opportunity to look for buy po
[MRVL] ABCD Harmonic Pattern forming for Bullish ProjectionFUNDAMENTAL ANALYSIS
1. The Sales and Cash flow are increasing but there was a slight decrease in NET-INCOME from last fiscal year. MRVL's net income dropped due to one-time items below operating income—a large prior-quarter gain and a financing charge—not business weakness. Core fundamentals (revenue +30%, strong cash flow, low debt, good ROE) are positive; valuation (P/E 75, P/S 21) and volatility are negative.
2. On Seasonality charts the major bullish move in MRVL starts after October. Hen