FTV Official Trading PlanFTV Official Trading Plan
1. Trading Instrument
Trading Instrument: FTV (US Stock)
2. Analysis Timeframe
Analysis Timeframe: 4H Band Trading
3. Entry Level
Wait for price pullback and go long near the market price at 55.00
4. Stop Loss Level
Full position stop loss placed at 54.000.
Strictly execute stop loss once the price breaks the stop loss level, no holding and no subjective adjustment. This trade is configured with a fixed risk-reward ratio of 1:9.
5. Take Profit & Risk Protection Rules
1. First Target: 58.00
Reduce half of the position, move stop loss forward to lock floating profits and protect remaining positions.
2. Second Target: 60.70
Reduce half of the remaining positions again, continue to push up stop loss to further expand profit protection range.
3. Third Target: 64.50
Reduce half of the remaining positions, push stop loss again to fully secure trading profits.
Leave the last tail position to run with the trend and dynamically adjust protection according to real-time price movement.
6. Position Sizing
Trade with a fixed 1:9 risk-reward ratio for 4H band trading. Control single trade risk within a reasonable range, prohibit over-sizing and averaging down against the trend. All position calculations strictly comply with the preset high reward trading structure.
7. Trading Cycle
4H cycle band trading. Wait for minor level pullback entry, hold positions according to trend structure, close partial positions step by step at each target level, and retain tail positions to capture further trend extension opportunities.
8. Risk Transaction Reminder
US stock markets are affected by U.S. macroeconomic data, Federal Reserve policy, corporate financial reports, industry sector rotation and global capital sentiment. 4H band trading has a longer holding cycle and faces overnight gap risks. Waiting for pullback entry reduces abnormal entry risk but cannot eliminate sudden intraday reversals and structural changes. Extreme market volatility, pre-market and after-hours trading slippage may affect the actual execution of stop loss and take profit. This trade adopts a high 1:9 risk-reward strategy which requires strict trading execution discipline. Graded position reduction and trailing stop protection can effectively control trading risks but cannot eliminate all market uncertainties. All position adjustment operations must be executed strictly in accordance with the preset plan, and impulsive temporary position opening and arbitrary position modification are prohibited.
Professional Disclaimer
All financial transactions involve huge risks such as price fluctuations, liquidity imbalance and sudden market reversals. The US stock market has session-specific risks, policy uncertainties and overnight gap risks. Stock trading and leveraged trading amplify both returns and risks, and may cause partial or total loss of principal. This trading plan is only for personal strategy reference and does not constitute any investment invitation or financial advice. All opening, closing and risk control decisions are independently executed by the trader, and all profit and loss consequences shall be borne solely by the trader.
 Long
Long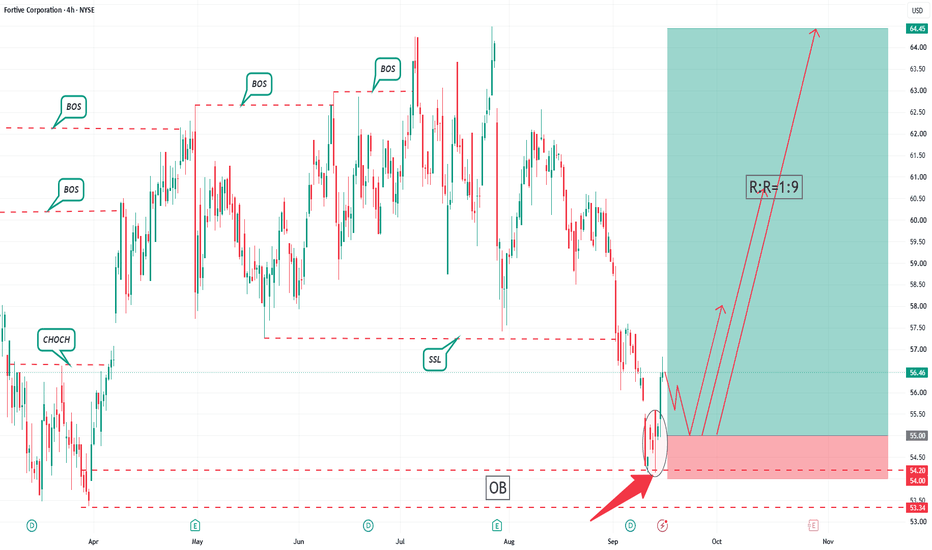
HON Official Trading PlanHON Official Trading Plan
1. Trading Instrument
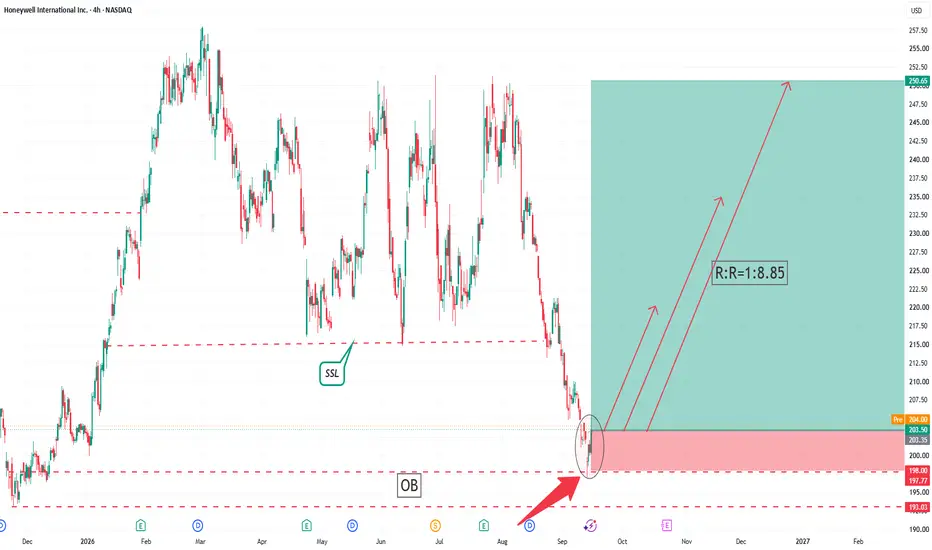
Trading Instrument: HON (US Stock)
2. Analysis Timeframe
Analysis Timeframe: 4H Band Trading
3. Entry Level
Go long near the market price at 203.50
4. Stop Loss Level
Full position stop loss placed at 198.00.
Strictly execute stop loss once the price breaks the stop loss level, no holding and no subjective adjustment. This trade is configured with a fixed risk-reward ratio of 1:8.85.
5. Take Profit & Risk Protection Rules
1. First Target: 220.00
Reduce half of the position, move stop loss forward to lock floating profits and protect remaining positions.
2. Second Target: 235.00
Reduce half of the remaining positions again, continue to push up stop loss to further expand profit protection range.
3. Third Target: 250.00
Reduce partial remaining positions, push stop loss again to fully secure trading profits.
Leave the last tail position to run with the trend and dynamically adjust protection according to real-time price movement.
6. Position Sizing
Trade with a fixed 1:8.85 risk-reward ratio for band trading. Control single trade risk within a reasonable range, prohibit over-sizing and averaging down against the trend. All position calculations strictly comply with the preset high reward trading structure.
7. Trading Cycle
2H cycle band trading. Hold positions according to trend structure, close partial positions step by step at each target level, and retain tail positions to capture further trend extension opportunities.
8. Risk Transaction Reminder
US stock markets are affected by U.S. macroeconomic data, federal interest rate policy, corporate earnings reports, sector capital rotation and global market sentiment, with volatile intraday movements and unexpected trend reversals. 4H band trading carries medium holding cycle risk, and price gaps and execution slippage may occur during pre-market and after-hours trading or extreme market fluctuations, affecting actual stop loss and take profit execution. This trade adopts a high 1:8.85 risk-reward strategy which requires strict trading discipline. Graded position reduction and trailing stop protection can effectively control trading risks but cannot eliminate all market uncertainties. All position adjustment operations must be executed strictly in accordance with the preset plan, and impulsive temporary position opening and arbitrary position modification are prohibited.
Professional Disclaimer
All financial transactions involve huge risks such as price fluctuations, liquidity imbalance and sudden market reversals. US stock markets have unique trading session risks and policy-related uncertainties. Leveraged and equity trading amplify both returns and risks, and may cause partial or total loss of principal. This trading plan is only for personal strategy reference and does not constitute any investment invitation or financial advice. All opening, closing and risk control decisions are independently executed by the trader, and all profit and loss consequences shall be borne solely by the trader.
 Long
Long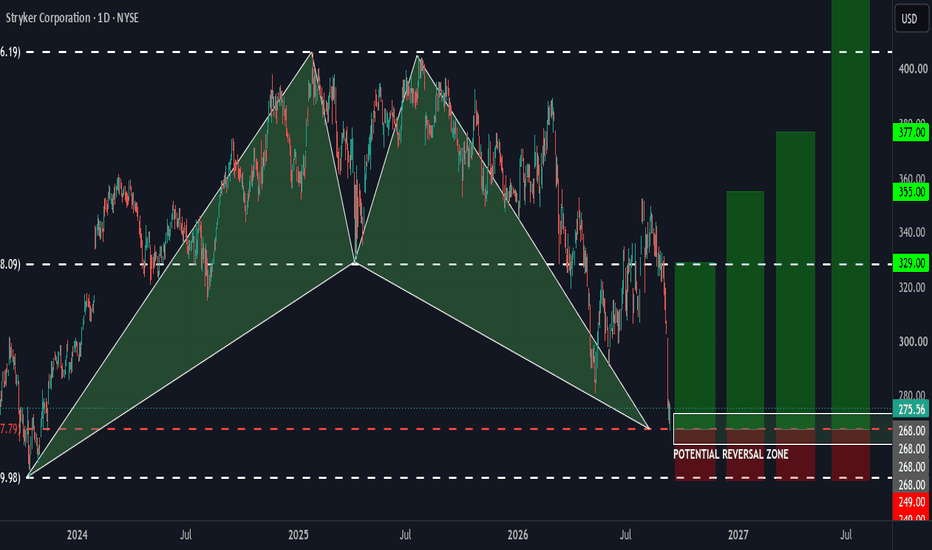
BCH/USD: 2 Bullish Structures Pointing Toward the Same ReversalBitcoin Cash is approaching an interesting area on the weekly chart where 2 different technical structures appear to be lining up around the same price level.
The first is a potential Elliott Wave triangle, with the market potentially completing wave (E) near the $112-115 area.
At the same time, there is a potential bullish harmonic pattern completing in essentially the same zone. When two different methods point toward the same area, I think it is worth paying attention.
The $112 -115 Area Is the Key
The chart shows a Potential Reversal Zone around $112-115.
This area also lines up with the rising yellow trendline, which gives us another reason to watch the level closely.
However, I would not simply buy $112-115 just because the pattern reaches the zone. I would want to see the price reaction and confirmation around this area. Although it will be essential a no brainer entry lol.
If the Elliott Wave triangle completes wave (E) and the bullish harmonic pattern completes at approximately the same level, a strong reaction could signal that the larger bullish move is beginning.
Potential Trade Setup
Based on the levels shown on the chart:
Entry: Around :$112-115
Stop: $71
Take Profit 1: $424.82
Take Profit 2: $800
Take Profit 3: $4,345
Take Profit 4: $9,500
The first target at $424.82 would be an important area to watch. If BCH can reach that level and continue showing strength, the much larger targets become possible.
What I Am Watching
The biggest thing for me is the $112-115 support area and the yellow trendline.
If price reaches the reversal zone and starts building a bullish reaction, it would give more credibility to both the potential Elliott Wave triangle and the bullish harmonic setup.
If BCH breaks decisively below the reversal zone and especially below the $71 invalidation level, the bullish idea would be weakened considerably.
Nothing is guaranteed, especially on a long-term chart like this. But having two different technical structures potentially completing around the same level, makes BCH/USD an interesting setup to watch.
For me, $112-115 is the level that matters.If the market confirms the reversal there, the upside potential shown on the chart is significant.
 Long
Long
 Short
Short
AUDNZD: EW Decision Point —Triangle Breakout or Bearish reversalGood day traders,
I trust your week has been a profitable one.
Please allow me to share my outlook on the current AUDNZD market.
AUDNZD is approaching a key decision zone, with two Elliott Wave scenarios competing for control. I think the next move should provide important confirmation of the medium-term direction.
Primary Case: Rally Into Resistance, Then Bearish Continuation
The primary count (above) suggests the current advance is completing wave (c) of a larger wave (b), with price potentially extending toward the 1.2100–1.2150 resistance zone.
A completed corrective structure and confirmed bearish reversal from this area could signal the beginning of a larger wave (c) decline, targeting the 1.18959–1.1800 region. A decisive drop from the current resistance zone at 1.2084-90 does not invalidate this scenario, as that would give us a running flat.
Alternate Case: Final Triangle Dip Before a Bullish Thrust
For the alternate count, I consider the decline from the 1.2250 high as a completed complex correction, followed by a contracting triangle. Under this scenario, price may make one final corrective wave e dip toward 1.1980–1.2000 , while holding above the key 1.1950 support zone. A subsequent impulsive breakout above the triangle's b–d trendline around 1.2090–1.2100 , followed by a break above 1.2120 , would favour a sharp move toward 1.2150–1.2200 . A decisive break (without dropping to the support zone) above the b wave at 1.21000 would invalidate this scenario.
From fundamentals point of view, the short-term outlook remains supportive of AUD. Australia's inflation remains high, and the RBA has kept its cash rate at 4.35% while maintaining a cautious stance toward further inflation risks. This means that continued AUD strength could support the bullish triangle thrust to as high as 1.22500 or higher , while stronger expectations of further RBNZ tightening relative to the RBA could eventually favour the bearish scenario.
Cheers and keep winning!  Long
Long
 Long
Long
 Short
Short
Gold Had a BIG Week… But I’m Watching This Level CloselyGold had quite the week.
Between the ongoing U.S.-Iran headlines and the dovish reaction from the U.S. dollar following Friday’s underwhelming Non-Farm Payroll report, there was plenty of fuel behind gold’s move higher.
But here’s the interesting part…
I’m actually watching for a potential short-term pullback in gold.
And there are two technical reasons why.
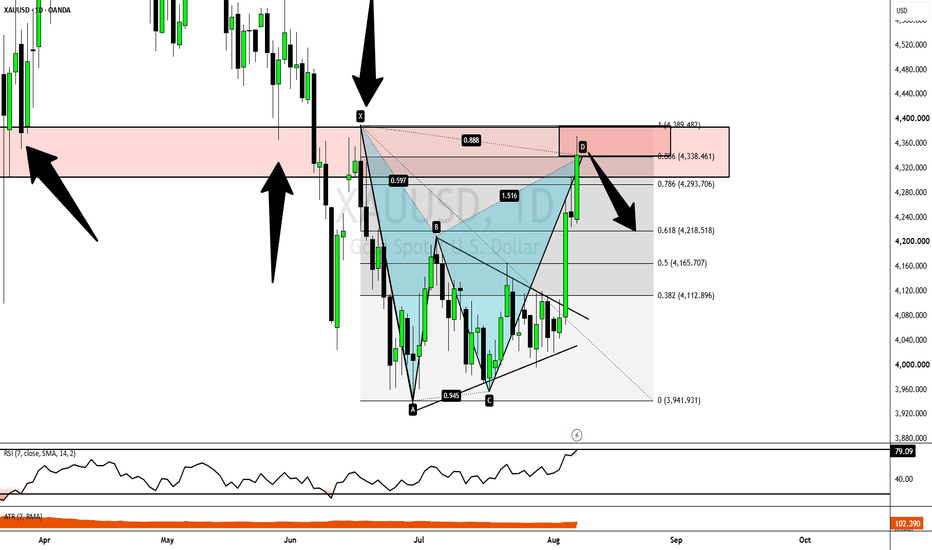
First, price is running directly into a previous level of structure.
This isn’t just any random level, either. It’s an area that previously acted as support before becoming resistance — what I like to call an “ice zone.”
Think of it like a sheet of ice:
It can support price from above, while simultaneously acting as resistance to price trying to break through from below.
Those types of levels can be pretty significant, especially when price returns to them after a strong directional move.
But there’s another reason I’m paying attention…
We also have an advanced pattern formation completing at this same area.
Specifically, a bearish Bat pattern.
The pattern is completing around the 88.6% Fibonacci retracement, and that completion zone lines up almost perfectly with the structure level I mentioned above.
That gives us something I always like to see:
Multiple pieces of technical confluence pointing toward the same area.
Now, this doesn't mean I'm expecting gold to completely reverse and begin a massive bearish trend.
With advanced patterns, I'm often looking for something much simpler:
A period of relief.
And there are some pretty logical reasons why sellers could step in here.
Some traders have ridden gold higher throughout the week and may be looking to take some profits.
Meanwhile, newer buyers may not want to chase price at these elevated levels. They may prefer to wait for a pullback before looking for another opportunity to get long.
But before you jump into a gold short…
There’s a BIG warning you need to hear.
The geopolitical situation surrounding Iran remains a major wildcard, and any changes to the ongoing peace talks could have a significant impact on gold.
And then there's the dollar.
The disappointing jobs report created a dovish reaction in the U.S. dollar, with the market adjusting its expectations around future Federal Reserve policy.
But here's the thing…
The jobs data isn't the only piece of the puzzle.
Inflation is still going to play a major role in determining what the Fed does next.
And we're getting a major inflation report this Wednesday with CPI.
That release could have a significant impact on the dollar — and because of the relationship between the dollar and gold, it could create some serious volatility there as well.
So while the technical picture is giving me a potential short-term gold opportunity…
I'm not ignoring the fundamental landmines sitting underneath it.
That's exactly why this week's market analysis is so important.
If you have any questions, comments or want to share your view on Gold please leave them below. And I wish you guys a safe & profitable week of trading!
Akil  Short
Short