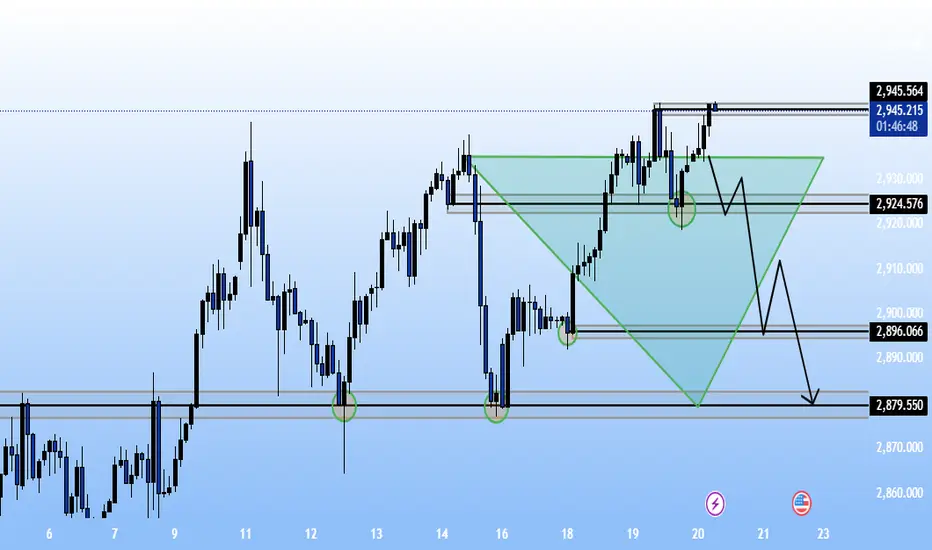
Candlestick chart.• Chart Type: Candlestick chart.
• Key Price Levels:
• The price is currently around 2,947.210.
• Resistance zone near 2,947.210 - 2,945.564.
• Support zones at 2,924.576, 2,896.066, and 2,889.915.
• Further downside target at 2,879.550.
• Pattern: A potential Head and Shoulders or Bearish Reversal pattern is drawn.
• Projection:
• A rejection from the upper resistance zone is anticipated.
• Price may consolidate before breaking lower.
• Bearish targets are marked at 2,896.066, 2,889.9
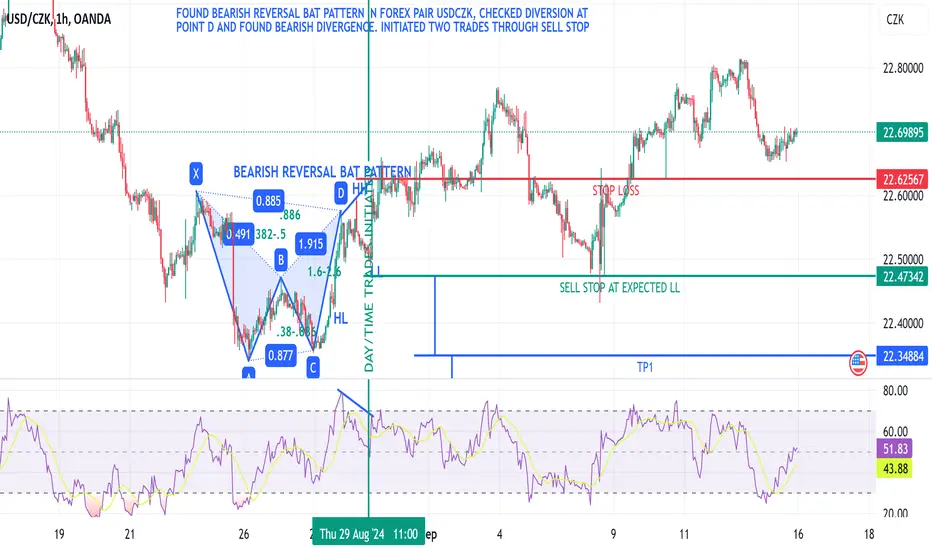
Bearish Bat
Energy Fuels Stock: Potential Reversal Ahead?AMEX:UUUU
After reaching a low of $0.78 in March 2020, AMEX:UUUU has been on a recovery path. Currently, it's forming an inverted head and shoulders pattern, with the key neckline at $7.47. A breakout above this level could signal a move towards $9.73.
However, watch out for the bearish alt-bat pattern near $9.73, which could lead to a pullback. Stay alert for key price action and adjust your risk accordingly.
⚠️ Note: Any violation of the $4.19 support would invalidate the projected pat
AUDCAD BAT PATTERNHarmonic Pattern Trading Strategy:
1. Combine patterns with 2-3 confirmations (e.g., MA, BB, RSI, Stoch) for increased accuracy.
2. Implement proper risk management.
3. Limit exposure to 3% of capital per trade.
4. Exercise caution: Not every Harmonic Pattern presents a good trading opportunity.
5. Conduct thorough diligence and analysis before trading.
Disciplined approach = Enhanced edge.
EURNZD BEARISH BATHarmonic Pattern Trading Strategy:
1. Combine patterns with 2-3 confirmations (e.g., MA, BB, RSI, Stoch) for increased accuracy.
2. Implement proper risk management.
3. Limit exposure to 3% of capital per trade.
4. Exercise caution: Not every Harmonic Pattern presents a good trading opportunity.
5. Conduct thorough diligence and analysis before trading.
Disciplined approach = Enhanced edge.
Dot Target why 20$ KUCOIN:DOTUSDT BINANCE:DOTUSDT BINANCE:DOTUSDT.P CRYPTOCAP:DOT
---
### **1. Fibonacci Retracement Analysis**
- **Levels Observed**:
- **0% (High)**: **55.081** (all-time high or recent significant high).
- **0.236**: **42.594**.
- **0.5**: **28.625** (midpoint of retracement).
- **0.618**: **22.381**.
- **0.65**: **20.688** (golden pocket).
- **0.786**: **13.491**.
- **1.0 (Low)**: **2.168** (all-time low or recent significant low).
---
### **2. Current Price**
- The
Price rengeBAT/USDT Chart:
Trend: Uptrend Price above moving average (yellow line).
Support: Green zone
Around 0.2317.
Resistance: Red zone Around 0.3778.
Possible Strategy:
Buy: Breaked EMA snd firs resistance
Sell: If price fails to break resistance
Note: Always consider market new and overall trends.
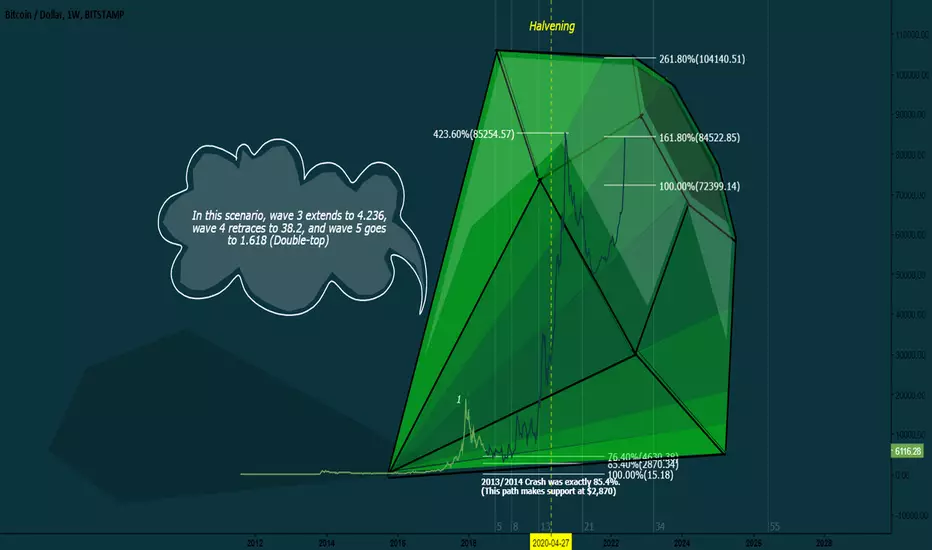
Could our next Bitcoin rally take us to $100,000?This is more of an experimental scenario, however there is always a probability this could happen. I just won't be too optimistic at this point since we are bearish at the moment and are still making New structure lows and Lower highs, however if we go to $2,800 and start showing signs of reversal it might be time to buy more for the long-term. This scenario calls for our bottom at $2,870; and our wave 3 top (if extended wave 3) would be $85,254 (4.236%, then a wave 4 should take us to the norma
GBP/NZD Hits Highest Level Since 2016: Is a Move Down Ahead?The GBP/NZD is currently testing its highest price in recent years, nearing the significant resistance level of 2.1900. This area has served as a notable barrier since 2016 and often sees increased selling interest. The price action in this zone, combined with the emergence of a harmonic pattern, suggests a potential reversal or correction. Furthermore, recent price movements, particularly the candles from October 30 and 31 breaking below the low of October 29, indicate rising bearish momentum,
GShort
USD/CHF Bearish Setup: Technical Analysis & Trade OpportunityPattern Formation: Bearish Bat Harmonic Pattern:
The USD/CHF is currently forming a Bearish Bat Harmonic Pattern, which suggests a potential reversal to the downside. The pattern is nearing completion at a key resistance level, providing a strong setup for a bearish entry.
Key Resistance and Fibonacci Confluence:
The pair has received a significant rejection from a crucial resistance zone, which aligns precisely with the 0.786 Fibonacci retracement level. This confluence strengthens the bea
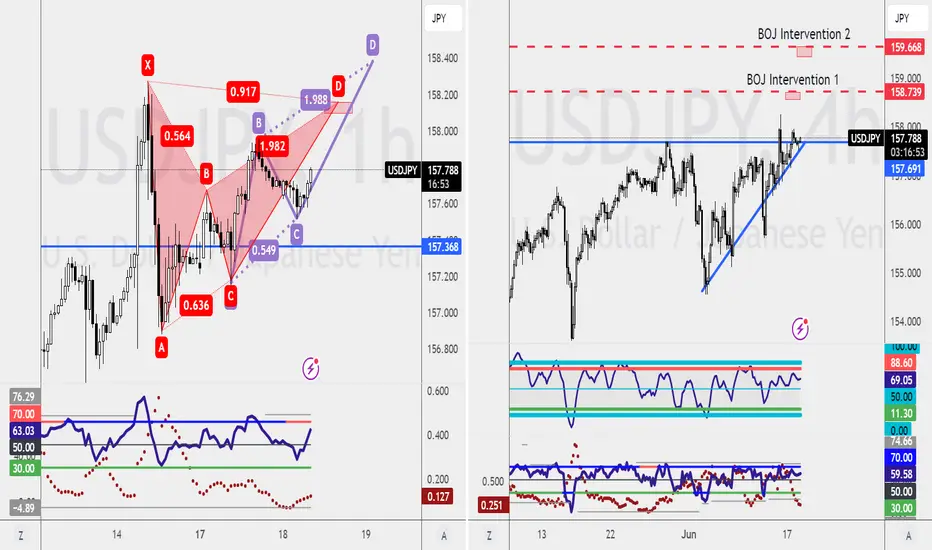
USDJPY Analysis and Trade OpportunitiesLike I mentioned in our weekend live session, I don't see any BOJ intervention happening soon.
The earliest I’m looking is when the market reaches 158.73, with the next level at 159.66.
Around 157.74 is the level I'll be looking for a buying opportunity using the existing strategy that I've used for many years.
Key Levels:
Potential Intervention Levels :
- 158.73
- 159.66
- Buying Opportunity : Around 157.74
Shorting Opportunities :
1-Hourly Chart :
- Bearish Bat Pattern Completion
EURUSD Bearish Trend and Bearish Bat Pattern CompletionEURUSD Bearish Trend and Bearish Bat Pattern Completion
Instrument: EUR/USD
Timeframe: 1-Hourly Chart
Current Direction: Bearish
Analysis:
EUR/USD is currently exhibiting a bearish trend. While the impulse to short immediately is strong, my preferred entry level is at 169.54. This price point aligns with the completion of a bearish bat pattern on the 1-hourly chart.
Key Points:
- Bearish Trend: The overall trend for EUR/USD is downwards.
- Bearish Bat Pattern: Completion level at 169.54,
EURUSD: A Sideway Consolidation with Bearish SignalsEURUSD is currently showing a sideway consolidation on the weekly chart, but the daily chart is painting a different picture:
- Bearish Fib-3 Bat pattern with RSI Divergence
I'm eyeing two potential entry points on the 1-hourly chart:
1. Resistance retest at 1.0852
2. Type 2 retest of the Bearish Bat Pattern at 1.0879
What's your take on this setup? Share your trade plans and thoughts in the comments!
Understanding Bearish and Bullish Bat Harmonic Patterns
Understanding Bearish and Bullish Bat Harmonic Patterns: A Professional Guide for Traders
In the dynamic world of trading, identifying potential reversal points is crucial for making informed decisions. Two powerful tools that professional traders often rely on are the Bearish and Bullish Bat Harmonic Patterns. These patterns, grounded in Fibonacci ratios, offer insights into market behavior and help in predicting price movements. This article delves into the intricacies of these patterns, p
USDJPY Short Opportunity: Key Factors and Strategic EntryHello, traders!
I’m on standby to short the USDJPY, and here's why this setup is compelling. This analysis covers two crucial parts, providing context and strategic entry points.
Part One: Macro Fundamentals
1. China’s Treasury Offload :
- China sold $53.3 billion of Treasuries and agency bonds in Q1 2024. This reduction in US dollar assets can impact USDJPY negatively.
2. BRICS Currency Moves :
- BRICS countries are trading $4 billion in local currencies, sidelining the US dollar. Thi
Learn from the Pros: Trading Quotes from Trading LegendsSpeculation is as old as the hills, says one of the world’s best traders of all time, Jesse Livermore. In this blog, we give you the best quotes by the best traders — use them to get inspired and realize that success in trading is possible.
Paul Tudor Jones, hedge fund manager, founder of Tudor :
“I always believe that prices move first and fundamentals come second.”
“If I have positions going against me, I get right out; if they are going for me, I keep them. Risk control is the most impo
SPX Showing Signs of Weakness at PCZ of a Bearish Alternate BatThe RSI on the daily has begun to rollover as the SPX appears to have rejected off of the Bearish Alternate Bat HOP level. There does not appear to be much nearby support within the range the SPX is currently trading in so if it gets back below the previous All-Time High I could see it coming back down to around $5100 maybe even $5000 - $4800. This all seems to be brought on by the increase in JGB Yields disrupting the Carry Trade. We may see them try to stabilize the carry trade around $5100 bu
#BAT/USDT#BAT
The price is moving in a triangle on a 12-hour frame, which it adheres to perfectly.
We have a major support area at the 0.2500 level.
We have stability above moving average 100.
We have a downtrend on the RSI indicator that supports the rise and is about to break higher
Entry price is 0.300
The first target is 0.3200
The second target is 0.3500
The third target is 0.3790
What's in a Trading Plan? Here's All You Need to Include.Ready, set… plan? In this guide, we discuss why you need to plan your trading before trading your plan. Let’s roll.
Table of Contents:
»Importance of a Trading Plan
»The Successful Trading Plan Doesn't Exi...
»What's in a Typical Trading Day?
»Markets, Strategies and Styles
»Summary
Venturing into trading without a plan is akin to setting sail on the ocean without a compass. Or taking the leap without looking first 😉. We can keep the metaphors rolling but if there’s one thing you must rem
TradingView Masterclass: The power of Bar Replay🚀 Unlocking Your Trading Potential with Bar Replay on TradingView
In the whirlwind of trading, having ace tools up your sleeve can dramatically shape your strategy and success. The spotlight shines bright on TradingView’s Bar Replay feature, a gem that offers a rewind on market movements, setting the stage for strategic mastery. Let's dive into what makes Bar Replay a must-use for traders eager to refine their game.
🕒 Understanding Bar Replay on TradingView
Bar Replay is
Bitcoin Analysis: Potential Resistance AheadOverview:
Bitcoin (BTC/USD) is approaching a key resistance level at $72,295, which could impact its near-term price action. Here's a breakdown of the current analysis and potential trading opportunities.
Technical Analysis:
- Resistance Level: Bitcoin is approaching a significant resistance level at $72,295.
- 4-Hourly Chart: A close above this level could indicate further upside potential, with the next resistance at $73,785.
- Buying Opportunities: Potential buying opportunities exist
TradingView Masterclass: Create your perfect chartDive into this video for a hands-on masterclass on TradingView's chart settings, created just for you! From the general themes to the smallest details, you'll learn how to fully customize your charts to match your unique trading style and preferences.
Discover how to access and adjust every aspect of your charts, making sure they look, present data, and integrate trading features exactly how you want. Here is what we'll cover in the video:
Make your data beautiful : Tweak symbol settin
The TradingView Digest - March 19thHello everyone! Welcome back to the TradingView Weekly Digest. We’re thrilled to bring you even more reasons to stay connected with the TradingView account. As part of our commitment to constantly evolve and improve our offerings for you, our dedicated users, this edition includes a special “What’s New “ section. In it, we explore the latest enhancements and additions to our platform, ensuring you're always up-to-date with our most recent advancements.
In today’s roundup, we’re excited to show