PUMP - The Next Big Pump Starts With a Pullback?The first rally got attention. The next pullback could offer the setup.
PUMP has broken out of its falling diagonal and delivered a strong five-wave rally. That supports the idea that a significant bottom is in - but the next move may require some patience.
The setup, explained simply
The long decline appears complete. After the first strong push higher, the chart now points to a three-part correction:
• A: The initial drop, currently developing.
• B: A recovery bounce.
• C: A final declin
Bullish Patterns
A Bearish Setup Is Emerging on Gold (1H)Gold appears to be moving within a corrective Diametric pattern. Wave F has recently completed, and the price seems to have entered Wave G, which is expected to be a bearish wave.
The red zone marked on the chart represents our supply area, where we will be looking for potential sell/short setups. If the price returns to this zone, we will look for a suitable short entry, preferably after observing confirmation within the marked area.
The targets have been clearly identified on the chart. Once
EUR/CHF BEST PLACE TO BUY FROM|LONG
EUR/CHF SIGNAL
Trade Direction: long
Entry Level: 0.925
Target Level: 0.927
Stop Loss: 0.923
RISK PROFILE
Risk level: medium
Suggested risk: 1%
Timeframe: 1h
Disclosure: I am part of Trade Nation's Influencer program and receive a monthly fee for using their TradingView charts in my analysis.
✅LIKE AND COMMENT MY IDEAS✅
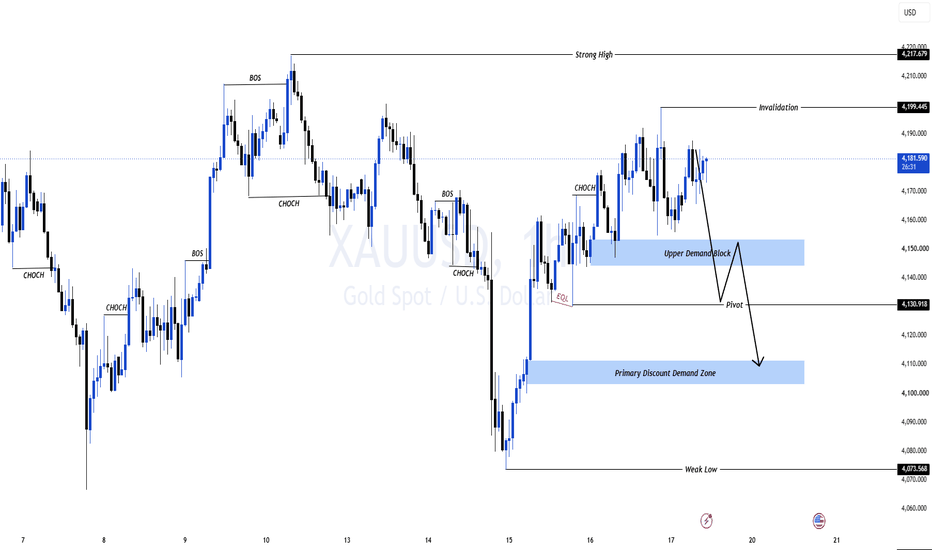
XAUUSD: Can Gold's Rebound Survive a Demand Test?Gold is holding its recovery, but buyers have yet to clear the resistance that would invalidate the chart's bearish pullback scenario.
The next meaningful test lies beneath current price: can demand hold when the rebound loses momentum?
MARKET OVERVIEW
Softer oil and declining Treasury yields are supporting gold early Monday. Persistent inflation pressure, however, keeps the Fed outlook uncertain.
This supportive backdrop makes bearish confirmation especially important before anticipating a
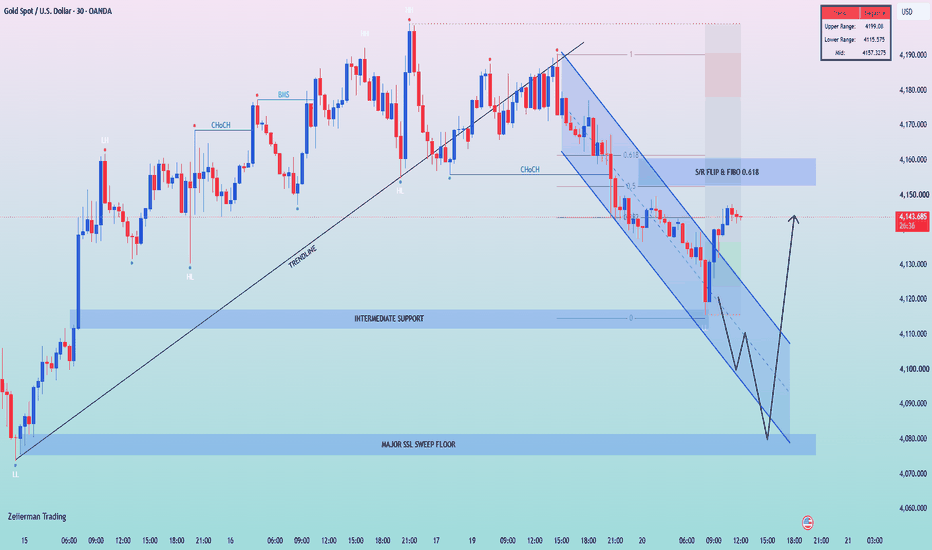
[XAUUSD] M30: Is 4,080 the Next Liquidity Draw?Gold has bounced from intermediate support. But a rebound inside a bearish structure can still become another selling opportunity.
The key question is whether buyers can reclaim broken resistance—or whether the market needs a deeper liquidity test first.
⚖️ MACRO BACKDROP
A softer dollar offered gold some support in Tuesday’s early reporting, while investors assessed next week’s Fed decision. Higher oil prices keep inflation risks relevant.
Treasury yields remain an important opportunity-cos
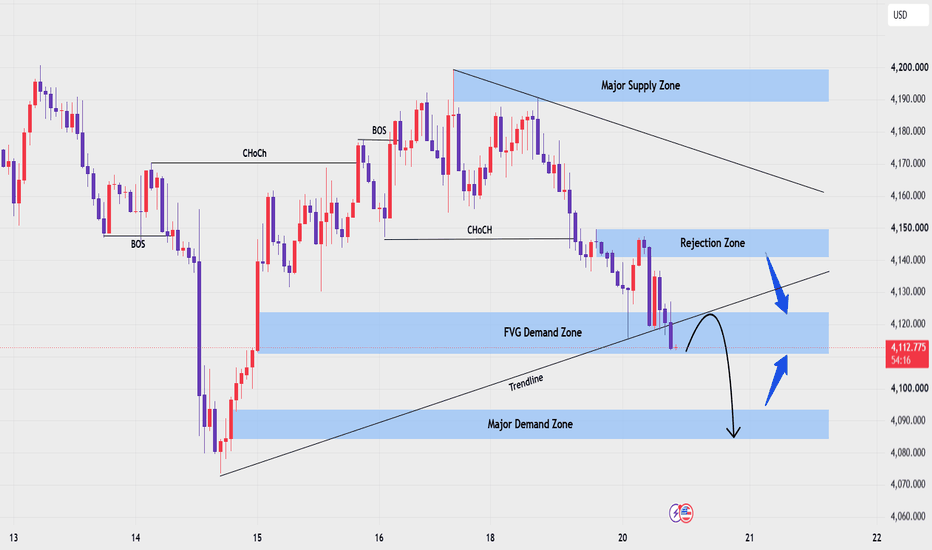
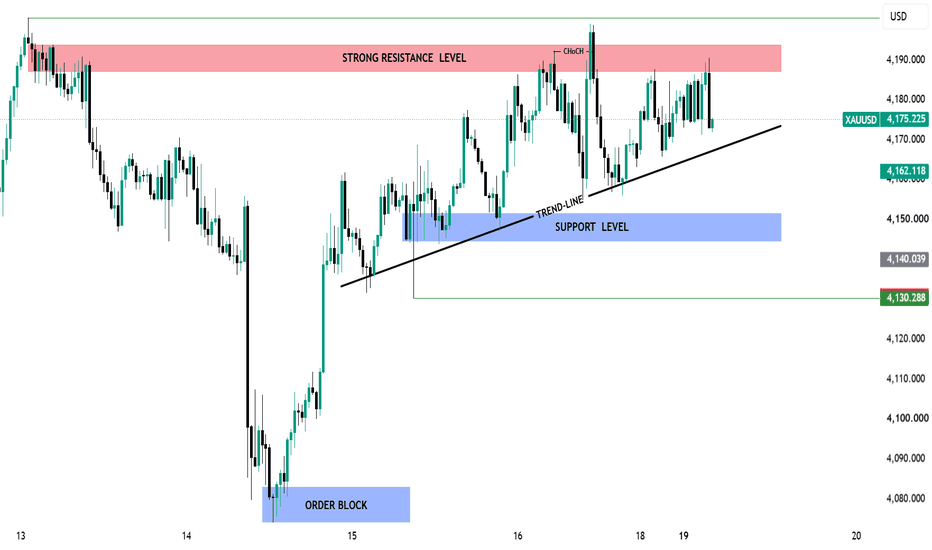
XAUUSD GOLD ANALYSIS STRONG RESISTANCE AND SUPPORT LEVEL'S Gold (XAUUSD) is approaching a strong resistance zone around 4188–4194 where selling pressure may appear. Price is currently moving above the ascending trendline, showing bullish momentum in the short term.
If price breaks above resistance and holds further upside may follow. However rejection from this zone could lead to a pullback toward the support area around 4145–4151
Keep an eye on price action trendline support, and breakout confirmation before entering a trade. Trade with proper risk m
H1 Bearish Structure After FVG Breakdown
Fundamental Analysis
Gold remains under pressure as the market reassesses the Fed’s path. September CPI rose 3.7% YoY, while PPI also came in hot, reinforcing concerns that inflation remains too persistent. At the same time, oil prices have climbed toward five-month highs amid geopolitical tensions and disruption risks around Saudi infrastructure and Gulf shipping, adding another inflationary pressure point. Reuters
The Fed is widely expected to hold rates at the October 27–28 meeting, but mar
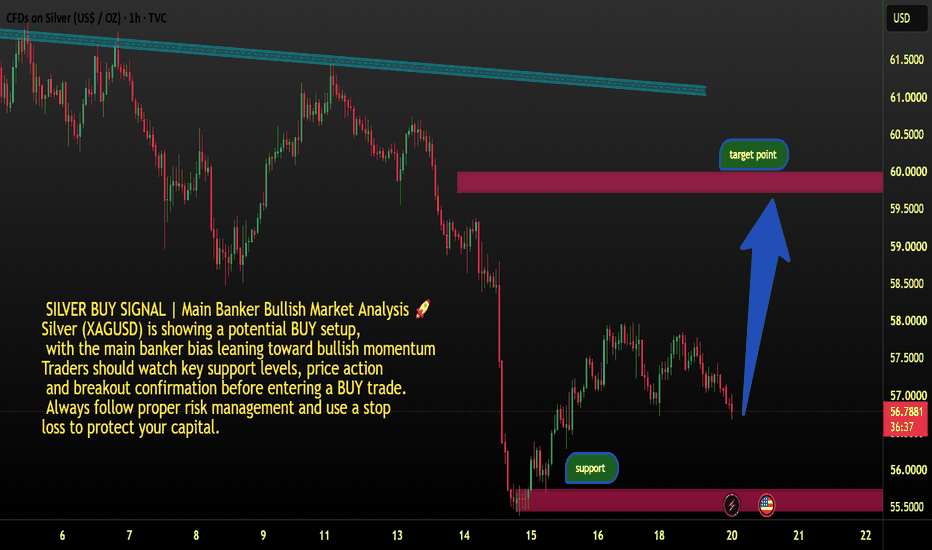
Silver may move upward if bullish momentum continues. Wait for p🟢 **SILVER (XAG/USD) — BUY SIGNAL**
📈 **Market Direction:** Bullish\
🎯 **Trade Action:** BUY\
💰 **Entry Price:** Confirm with the current market price\
🛑 **Stop Loss (SL):** Below the recent support level\
✅ **Take Profit (TP):** Near the next resistance level
📊 **Market Outlook:** Silver may move upward if bullish momentum continues. Wait for price confirmation before entering the trade.
⚠️ **Risk Management:** Always use a stop loss and manage your trading risk carefully.
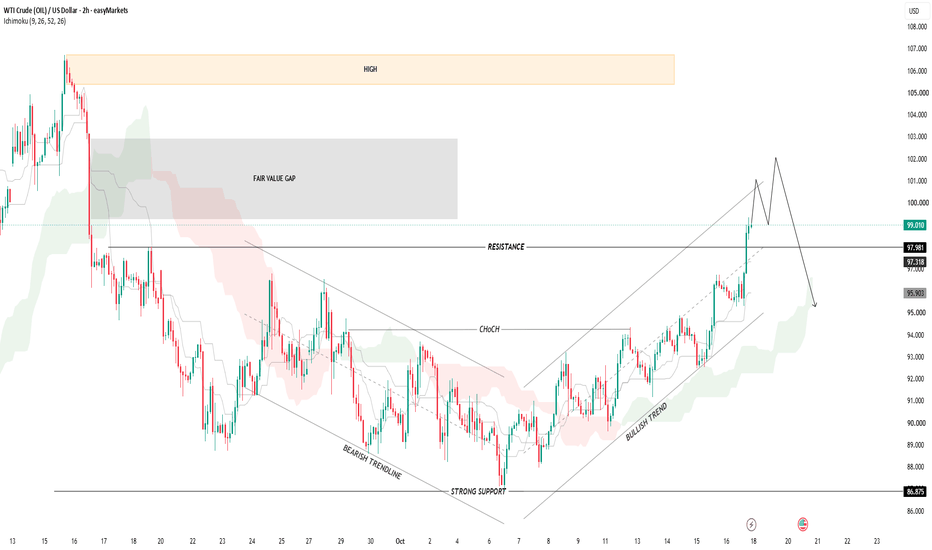
WTI CRUDE OIL — Bullish Breakout, Key Resistance & Potential Pu# 🛢️ WTI CRUDE OIL — Bullish Breakout, Key Resistance & Potential Pullback 📊
WTI Crude Oil has shown a strong recovery after finding support around **86.875**, gradually building a bullish structure with higher highs and higher lows. The price has moved along an ascending trendline, indicating improving buying pressure after the previous bearish phase.
📈 **1. Market Structure & Trend**
The chart shows a transition from a bearish trend to a bullish recovery. The earlier descending trendline ha
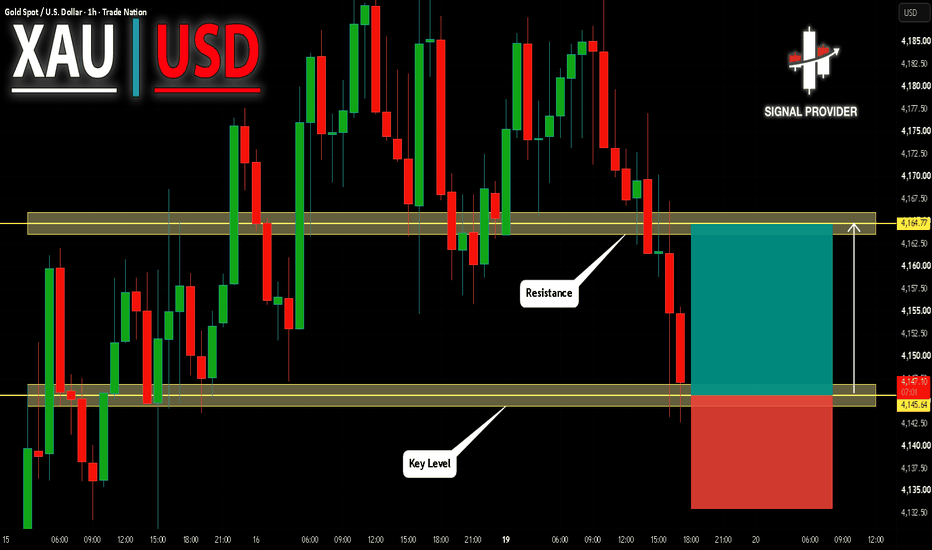
GOLD Will Go Down From Resistance! Short!
Here is our detailed technical review for GOLD.
Time Frame: 1h
Current Trend: Bearish
Sentiment: Overbought (based on 7-period RSI)
Forecast: Bearish
The market is approaching a significant resistance area 4,145.64.
Due to the fact that we see a positive bearish reaction from the underlined area, I strongly believe that sellers will manage to push the price all the way down to 4,164.77 level.
P.S
Please, note that an oversold/overbought condition can last for a long time, and therefore bei
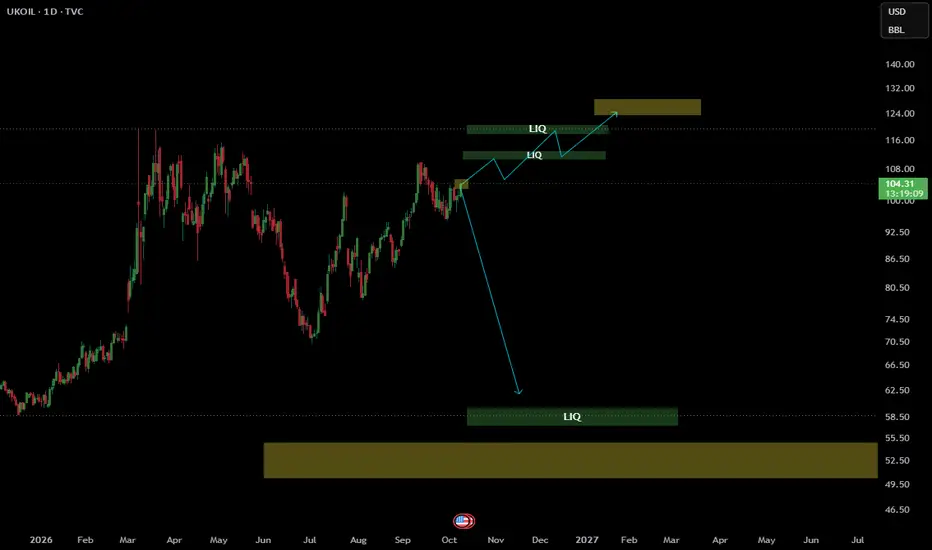
Brent Structural DecisionUKOIL is trading around $104. VERY important zone in this cycle.
The downside structure points toward $61.5–58.5, with $50–54 below.
On the upside, $112–120 is the key liquidity zone.
A move above $120–124 invalidates the current bearish structure, and a new one will emerge from that. Until then, both directions remain valid.
Price determines the path.
Follow, Boost, Join, Thank You!
Financial Disclaimer: This post is not financial advice. I am not your financial advisor, your life coach, or
The Elephant Jungle 10/20/26 Page 3So What’s The Play Today Red?
For shorts, I am watching the 10m Order Block, which lines up with the Golden Pocket, with both sitting in the Premium Zone of Inside Range 2. That is the first area I have my eyes on.
If I do not get any confirmations there, I will be watching the 15m Order Block or the 30m Order Block for another short opportunity. No need to force a trade when the market has other levels to work with.
As for longs, I am watching to recycle the 4H Order Block. Maybe the fresh 15m
XAUUSD: Sell high, buy low!Looking ahead at the gold price trend for the next 15 days, the market is currently influenced by numerous variables, with uncertainty continuing to rise. We must closely monitor three core factors: policy signals from recent remarks by Federal Reserve officials, the ongoing evolution of the geopolitical situation in the Middle East, and a series of key economic data releases expected this week. These will serve as indicators to help confirm the market's direction.
Technical Analysis: On the da
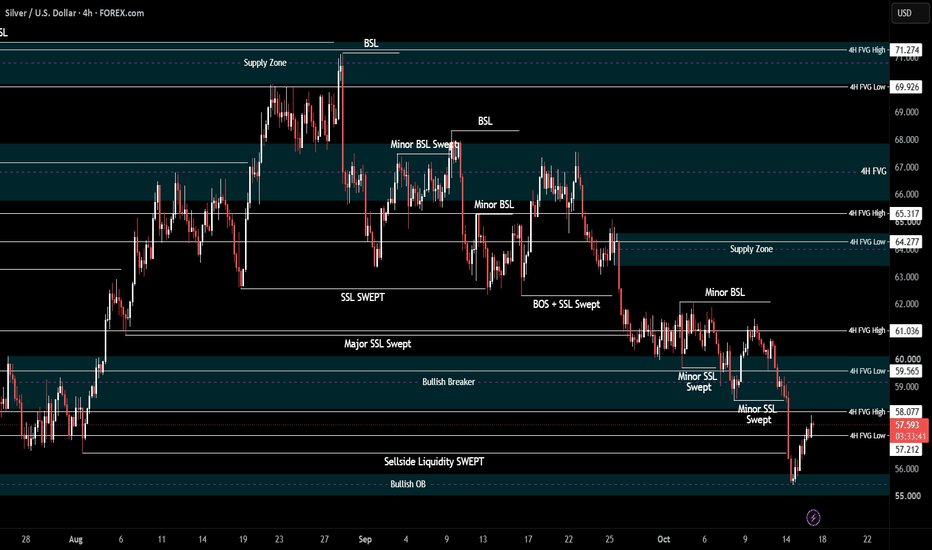
XAG/USD | Recovery after CPI & PPIAfter CPI and PPI in this week and an initial heavy drop after the CPI, Silver dropped to the Bullish OB and managed to recover a bit, going from 55.39 to 57.94, before dropping a bit, currently being traded at around 57.50 level, inside the 4H FVG, below the consequent encroachment of the gap.
Now, I expect Silver to stabilize above the FVG C.E. at 57.64, and then go towards the FVG High at 58.07, break above it and go towards 58.50, 59.00, 59.50 and 60.00 levels respectively, breaking above t
EURUSD Bullish Reversal SetupEURUSD is showing signs of a potential bullish recovery after bouncing from the support zone around **1.1165–1.1175**. Price has recovered from recent lows and is currently trading near 1.1199, suggesting that buyers are attempting to regain control.
The chart indicates a possible retest of the support area before another upward move. If the support holds and bullish momentum strengthens, the first target is **1.1227**, followed by the major resistance zone near **1.1269**.
🎯 **Target 1:** 1.1
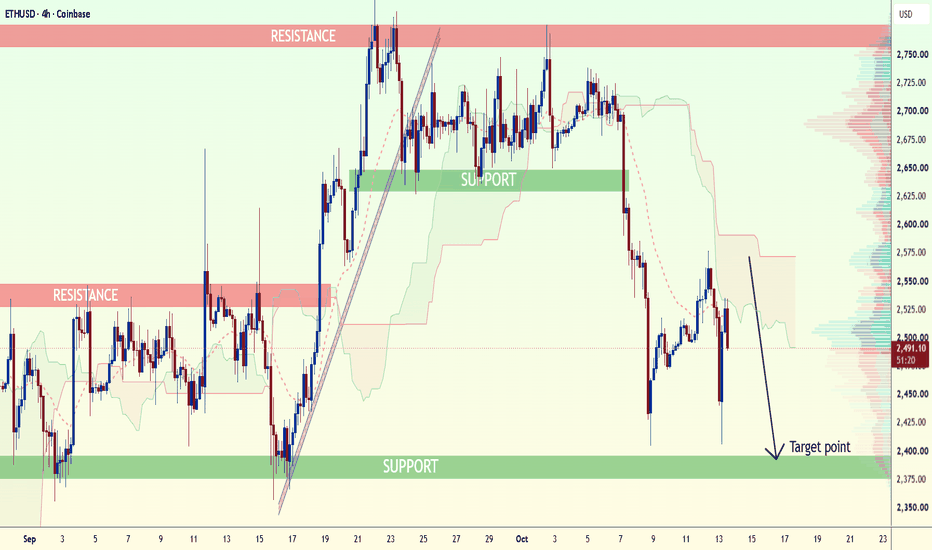
Bearish Continuation Toward $2,380 SupportETHUSD is showing strong bearish momentum on the 4-hour chart after facing rejection from the $2,700–$2,780 resistance region. The price broke below the key $2,630–$2,650 support zone, triggering a sharp downward move and indicating that sellers are currently in control.
The recent recovery toward $2,550 appears to be a possible bearish pullback, with price struggling to regain the broken support levels. If selling pressure continues and ETH remains below the $2,530–$2,550 resistance area, the
Oil | At the Wall of ResistanceKey Observations:
Spot vs Futures:
While the broader structure tracks closely, local divergence shows up around contract roll periods and broker fed volume feeds (noted at the orange arrows). Notice the variance in pullbacks and volume spikes between the exchange traded tape and spot feed.
Ascending Channel Structure: Crude remains inside the upward sloping channel from the summer base, but price action is pressing directly into multimonth horizontal resistance ($98-$100 area).
Volume & Momen
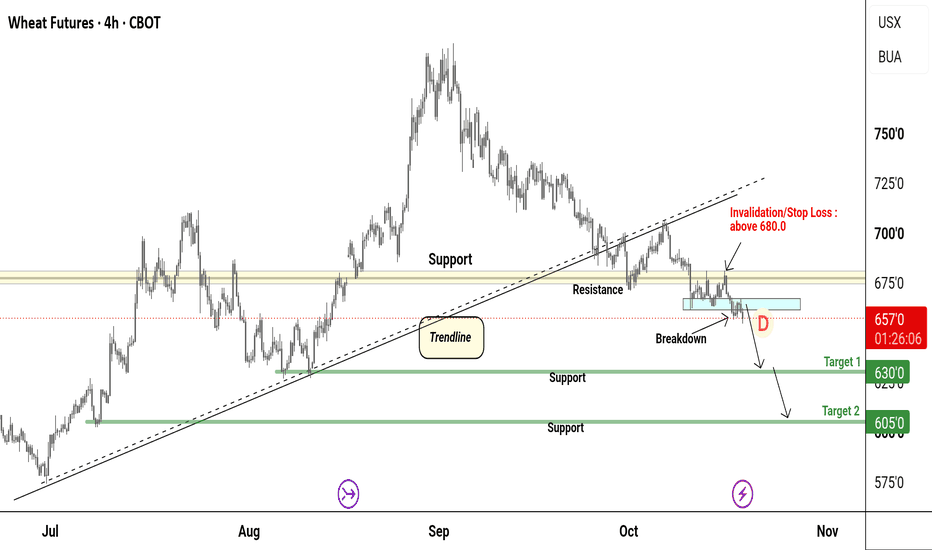
Wheat Futures : Major Support Breakdown And Retest Bearish SetupExecutive Summary
The 4-hour chart for CBOT Wheat Futures presents a high-probability bearish continuation setup following a decisive structural breakdown below a major multi-week ascending trendline and the critical 680'0 support level. Price has completed a retest of this former support zone, which has successfully flipped into resistance. The core thesis anticipates sustained downward momentum targeting a move of approximately 3.96% down to Target 1 at 630'0, with an extended downside extens
#WTI: Oil at $110? Trump's Three-Dimensional Chess🛢 WTI crude oil is once again approaching $100 per barrel. In previous reviews, we discussed the breakout from the $78–86 range, which marked the emergence of a bullish trend. The lack of significant selling pressure above $90 allowed buyers to extend the rally.
🌍 Geopolitics remains the main driver. If tensions in the Middle East persist, a breakout above $104–105 could open the way toward $110.
♟ But could expensive oil be part of a larger U.S. geoeconomic strategy? Higher prices benefit Ame
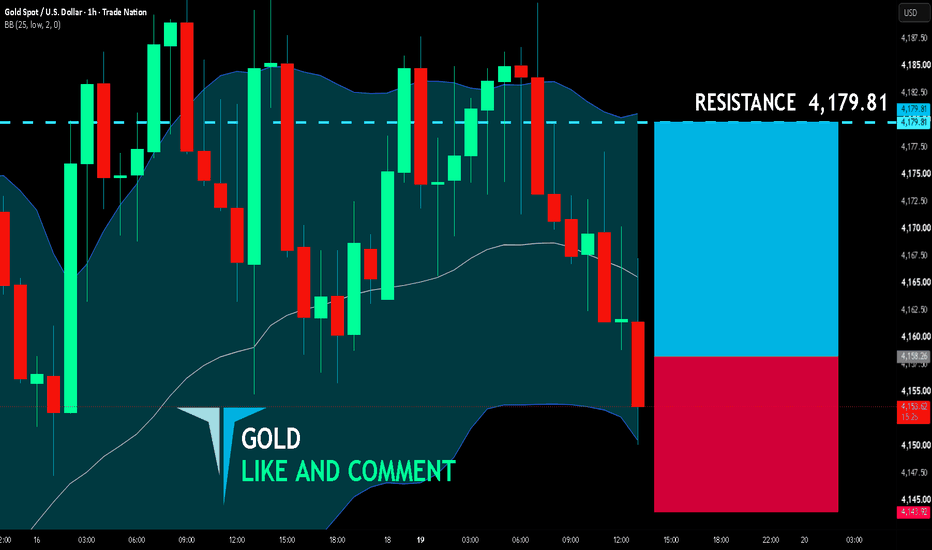
GOLD BULLS ARE STRONG HERE|LONG
GOLD SIGNAL
Trade Direction: long
Entry Level: 4,158.26
Target Level: 4,179.81
Stop Loss: 4,143.92
RISK PROFILE
Risk level: medium
Suggested risk: 1%
Timeframe: 1h
Disclosure: I am part of Trade Nation's Influencer program and receive a monthly fee for using their TradingView charts in my analysis.
✅LIKE AND COMMENT MY IDEAS✅
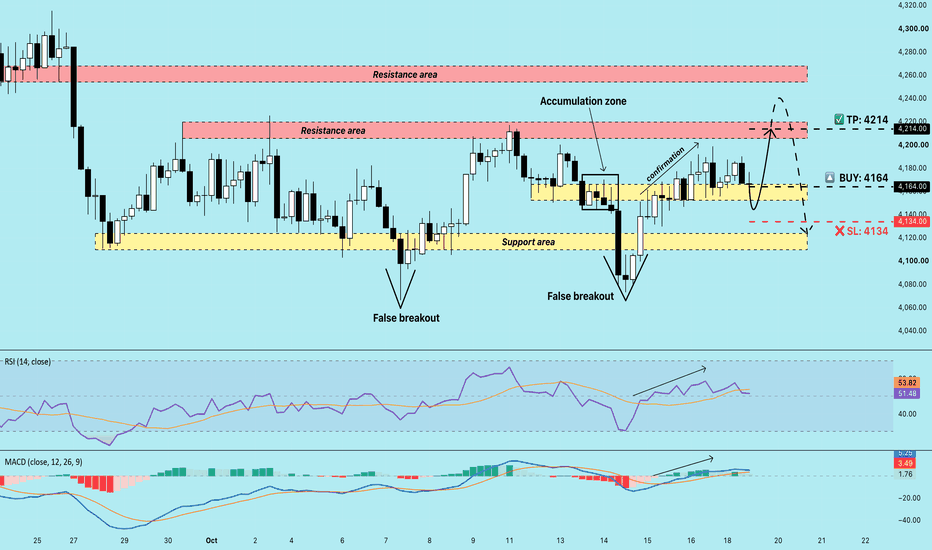
XAUUSD 19/10/26: Buyers' target is 4220IndiShark is here! 🌊
Gold remains inside the broader 4120–4220 range, with the latest recovery keeping a test of the upper boundary in focus. The immediate setup favors a short-term move higher, while rejection near 4220 could later restore the selling scenario.
My plan:
🔼 BUY: ~ 4164
❌ SL: 4134 | ✅ TP: 4214
Key points 👇
➡️ The failed breakdown below the lower support zone was followed by a sharp recovery. Price has since held above that zone and reclaimed the former accumulation area
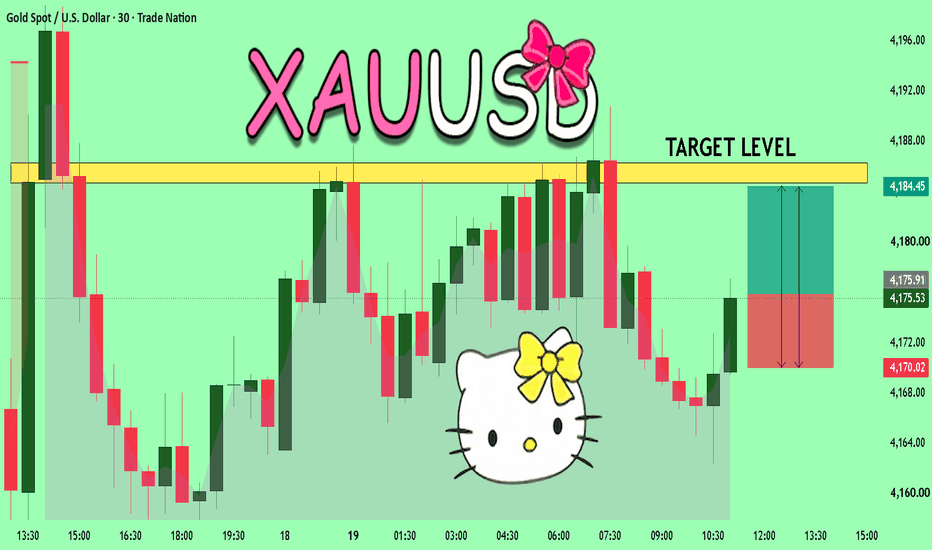
GOLD What Next? BUY!
My dear friends,
Please, find my technical outlook for GOLD below:
The instrument tests an important psychological level 4175.9
Bias - Bullish
Technical Indicators: Supper Trend gives a precise Bullish signal, while Pivot Point HL predicts price changes and potential reversals in the market.
Target - 4184.7
Recommended Stop Loss - 4170.0
About Used Indicators:
Super-trend indicator is more useful in trending markets where there are clear uptrends and downtrends in price.
Disclosure: I a