XAGUSD 15-Minute Minor Swing Trading Long PlanXAGUSD 15-Minute Minor Swing Trading Long Plan
Basic Trading Parameters
• Trading Pair: XAGUSD
• Time frame: 15 Minutes
• Trading Style: Minor Swing Long Trade
• Entry Level: Around 51.468 (Direct market long entry)
• Hard Stop Loss: 51.150
• Risk-Reward Ratio: 1 : 9.17
Entry Rule
Open long position directly near the current market price of 51.468 following the bullish minor swing structure on the 15-minute time frame.
Tiered Take Profit & Dynamic Risk Management
1. First Target: 52.2
Candlestick Analysis
XAUUSD 15-Minute Minor Swing Trading Long PlanXAUUSD 15-Minute Minor Swing Trading Long Plan
Basic Trading Parameters
• Trading Pair: XAUUSD
• Time frame: 15 Minutes
• Trading Style: Minor Swing Long Trade
• Entry Level: Around 4044.000 (Direct market long entry)
• Hard Stop Loss: 4030.000
• Risk-Reward Ratio: 1 : 8.36
Entry Rule
Open long position directly near the current market price of 4044.000 following the bullish minor swing structure on the 15-minute time frame.
Tiered Take Profit & Dynamic Risk Management
1. First Target
XAGUSD 15-Minute Minor Swing Trading Short PlanXAGUSD 15-Minute Minor Swing Trading Short Plan
Basic Trading Parameters
• Trading Pair: XAGUSD
• Time frame: 15 Minutes
• Trading Style: Minor Swing Short Trade
• Entry Level: Around 53.430 (Direct market short entry)
• Hard Stop Loss: 53.600
• Risk-Reward Ratio: 1 : 10.38
Entry Rule
Open short position directly near the current market price of 53.430 following the bearish minor swing structure on the 15-minute time frame.
Tiered Take Profit & Dynamic Risk Management
1. First Target:
BNBUSDT 15-Minute Minor Swing Trading Short PlanBNBUSDT 15-Minute Minor Swing Trading Short Plan
Basic Trading Parameters
• Trading Pair: BNBUSDT
• Time frame: 15 Minutes
• Trading Style: Minor Swing Short Trade
• Entry Level: Around 689.770 (Direct market short entry)
• Hard Stop Loss: 691.500
• Risk-Reward Ratio: 1 : 8.25
Entry Rule
Open short position directly near the current market price of 689.770 following the bearish minor swing structure on the 15-minute time frame.
Tiered Take Profit & Dynamic Risk Management
1. First Tar
XAUUSD 15-Minute Swing Trading Short PlanXAUUSD 15-Minute Swing Trading Short Plan
Basic Trading Parameters
• Trading Pair: XAUUSD
• Time frame: 15 Minutes
• Trading Style: Swing Short Trade
• Entry Level: Around 4137.780 (Direct market short entry)
• Hard Stop Loss: 4147.500
• Risk-Reward Ratio: 1 : 6.8
Entry Rule
Open short position directly near the current market price of 4137.780, following the bearish swing structure on the 15-minute time frame.
Tiered Take Profit & Dynamic Risk Management
1. First Target: 4116.000
Close 50
UNIUSDT 15-Minute Minor Swing Trading Short PlanUNIUSDT 15-Minute Minor Swing Trading Short Plan
Basic Trading Parameters
• Trading Pair: UNIUSDT
• Time frame: 15 Minutes
• Trading Style: Minor Swing Short Trade
• Entry Level: Around 7.087 (Direct market short entry)
• Hard Stop Loss: 7.120
Entry Rule
Open short position directly near the current market price of 7.087 following the bearish minor swing structure on the 15-minute time frame.
Tiered Take Profit & Dynamic Risk Management
1. First Target: 6.950
Close 50% of the total pos
Downtrend in MGM Resorts?MGM Resorts has rebounded after a big slide, and some traders may think it’s still trending lower.
The first pattern on today’s chart is the bearish gap on September 24 after the withdrawal of a takeover offer. The casino stock rebounded to stall around the same level, which could suggest it’s becoming resistance.
Second, a bearish outside day occurred on November 5. Prices could also be getting stuck at that potential reversal signal.
Third, the recent highs are near the March low of $33.45.
NZDCAD: Bearish Move From Resistance Confirmed 🇳🇿🇨🇦
NZDCAD will likely drop from a major daily resistance cluster.
A head and shoulders pattern formation on an hourly time frame and a confirmed breakout of its neckline after the news provide strong confirmation.
Goal - 0.7916
❤️Please, support my work with like, thank you!❤️
I am part of Trade Nation's Influencer program and receive a monthly fee for using their TradingView charts in my analysis.
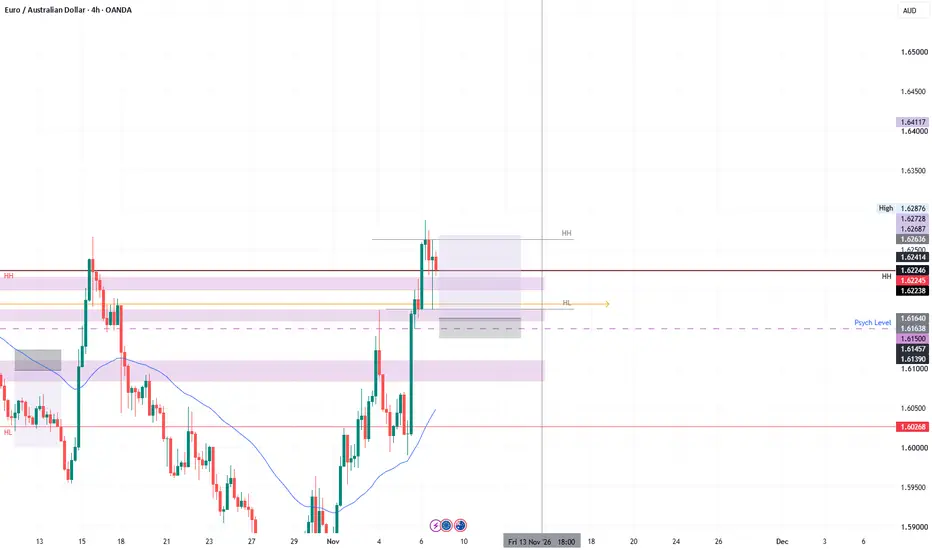
EURAUD LONGMarket structure bullish on HTFs 3
Entry at both Weekly and Daily AOi
Weekly rejection at AOi
Previous Weekly Structure Point
Daily Rejection at AOi
Around Psychological level 1.61500
Touching EMA H4
H4 Candlestick rejection
Rejection from Previous structure
TP: WHO KNOWS!
Entry 110%
REMEMBER : Trading is a Game Of Probability
: Manage Your Risk
: Be Patient
: Every Moment Is Unique
: Rinse, Wash, Repeat!
: Christ is King
GOLD (XAU/USD): Consolidation ContinuesHere is a brief update on 📉Gold.
The market is currently consolidating within a broad horizontal range on the 4-hour timeframe.
Following a test of the resistance level, we see a significant bearish reaction, followed by the formation of a double top pattern and a subsequent break of the neckline.
I anticipate that the price may decline toward the support level of the range, with a target of 4035.
CPI on US100NOT FINANCIAL ADVICE, EDUCATION ONLY
1.based on past CPI data, CPI heavily respects order blocks on US100
2. the blue block is an order block/supply zone on the h4 timeframe
3. based on past data CPI usually forms its lowest point 1 hr 30 min before the actual news release.
4. based on past data, CPI will likely heavily push to fill the order block/supply zone 15 min before actual news release.
5. CPI will likely crash the market downwards after release as its in confluence with both supply an
AUDCAD SELL TRADE IDEAMarket structure and market trend has aligned wonderfully, we clearly see the last break of structure to the downside and a nice clean supply area that facilitated that break.
With a clean confirmation we can now take sell towards the draw on liquidity but target the last internal range liquidity as a good take profit level.
SRP: huge volume and a rejection wick at the highsHas the valuation become too stretched for the long term holders? That would be a good reason to sell.
I don’t have a detailed view, and it’s not a company I tend to follow. But the price action tells me a lot of selling took place leading up to Friday.
The effort was clear. Volume hit 3.78x the average, with a rejection wick to the upside. That suggests plenty of sell orders were being hit. Buyers wanting more stock would have had to push the price higher to get it, and they didn’t.
Will the
CRUDE OIL (WTI): Bearish Continuation After Breakout
Crude Oil will likely continue falling after a confirmed breakout of a strong intraday horizontal support.
Next goal - 84.3
❤️Please, support my work with like, thank you!❤️
I am part of Trade Nation's Influencer program and receive a monthly fee for using their TradingView charts in my analysis.
EURCHF: Bearish Move After Trap 🇪🇺🇨🇭
I see a valid buy-side liquidity grab on EURCHF.
The price formed a long upper wick above a strong intraday horizontal resistance.
The price will likely retrace to 0.9186
❤️Please, support my work with like, thank you!❤️
I am part of Trade Nation's Influencer program and receive a monthly fee for using their TradingView charts in my analysis.
CRUDE OIL (USOIL): Massive Support BreakoutFollowing the significant decline in 📉Crude Oil prices last week, the market successfully broke and closed below a major horizontal support cluster.
The next significant historical daily support level is located in the 81.12 to 79.64 range. This will likely serve as the primary long-term goal for sellers.
EURCHF SHORTsMarket structure bearish on HTFs 3
Entry at both Weekly and Daily AOi
Weekly Rejection at AOi
Daily Rejection at AOi
Previous Daily Structure Point
Around Psych Level 0.91500
H4 Candlestick rejection
Rejection from Previous structure
TP: WHO KNOWS!
Entry 105%
REMEMBER : Trading is a Game Of Probability
: Manage Your Risk
: Be Patient
: Every Moment Is Unique
: Rinse, Wash, Repeat!
: Christ is King
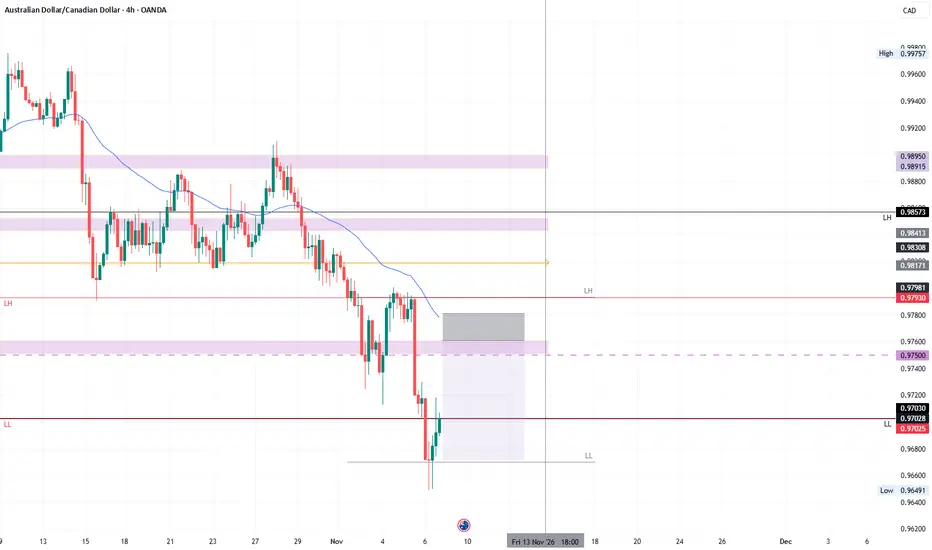
AUDCAD SHORTsMarket structure bearish on HTFs 3
Entry at both Weekly and Daily AOi
Weekly rejection at AOi
Daily Rejection at AOi
Previous Daily Structure Point
Around Psychological Level 0.97500
Touching EMA H4
H4 Candlestick rejection
Rejection from Previous structure
TP: WHO KNOWS!
Entry 110%
REMEMBER : Trading is a Game Of Probability
: Manage Your Risk
: Be Patient
: Every Moment Is Unique
: Rinse, Wash, Repeat!
: Christ is King
HOC: buyers stepping in at an old support level?I rarely, if ever, invest in miners and oil explorers. But I’m happy to trade them because they offer such wild price moves.
Hochschild is no different. It has slid from a recent high of around 705p to 430p today, which may offer another upswing opportunity.
The volume profile on the right doesn’t tell me much here. It’s just a mass of volume.
The daily volume bars are more telling. The last two days saw volume spike to 2.2x the average. That said, big volume spikes aren’t unusual for this on
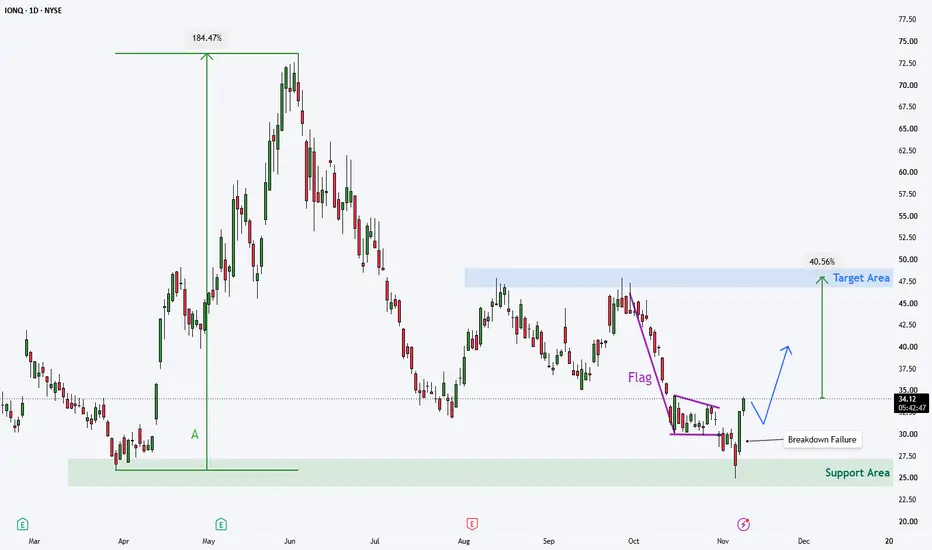
IONQ – Potential Bounce From Support
The last time the stock traded around the $26 level, it went on to deliver a 184% rally (A). Since then, the price has not revisited this level, suggesting that it could now act as support.
Looking at the chart, we can see that the price broke down from a Flag formation but made very little downside progress before reversing back to the upside. This potentially created a Breakdown Failure setup.
We therefore have several bullish factors coming together:
NZDJPY: Another Bearish Wave Ahead 🇳🇿🇯🇵
NZDJPY broke and closed below a major horizontal structure support on Friday.
The price set a new lower low lower close.
I expect a bearish trend continuation after the completion of a corrective move.
Monitor a strong falling trend line that I mapped.
It is the first strong resistance to watch.
❤️Please, support my work with like, thank you!❤️
I am part of Trade Nation's Influencer program and receive a monthly fee for using their TradingView charts in my analysis.
XAU/USD | Gold Reclaims $4100! Can Buyers Break the $4145 SZ ? By analyzing the #Gold chart on the 1H timeframe, we can see that buyers have made a strong comeback! After reaching the $4040 area and reacting from the bullish order block around $4030 – $4050 , Gold recovered sharply, breaking several short-term resistance levels and reclaiming $4085 and $4100 . Price is now trading around $4115 , suggesting that bullish momentum is gaining strength again.
In my view, the $4120 – $4145 area is now extremely important. Gold is approaching the major bea
Can Oil Continue to Sell?Looks like gold is ready to sell off further.
If there is no further military action in the Middle East, oil prices may fall further.
The resistance is holding up at the moment.
This is my analysis; it is not financial advice.
What do you think about this analysis?
Let me know in the comment box. Don't forget to follow me now and share this analysis with your friends.
Cheers!