Episode 08 — The Architecture Behind the Waves🎬 Mr. Nobody’s Chronicle
Season I — The History of Elliott Wave Principle
Episode 08 — The Architecture Behind the Waves
⏱️ Reading time: ~3 minutes
“When we discover the language of a pattern, the next question is: How is it built?”
In the previous episode, we reached one of the most recognizable ideas behind the Wave Principle:
Five waves in the direction of the main movement...
and three waves in the corrective direction.
But one important question remained.
Do all waves have the same ch
Economic Cycles
🇪🇺🇺🇸 EUR/USD 3H | When Structure Gets Complex🇪🇺🇺🇸 EUR/USD 3H | When Structure Gets Complex, the Path Is Not Always Straight 🌀
⏱️ Reading time: about 3 minutes
Following our weekly EUR/USD analysis, we are now moving closer to the 3-hour chart to examine what the current structure may be building at the lower degree.
At this stage, the bearish scenario carries more weight, and a continuation of the downward move remains one of the important structural possibilities.
Within this scenario, the current structure may be developing as a Leadi
Silver | One Structure, Two Possible Paths⏱️ Reading time: about 3 minutes
Following our previous Silver analyses, this time we are looking at the chart from the perspective of the previous high, allowing the relationship between the larger historical structure and the current movement to become clearer.
In this view, we have been tracking a larger corrective structure from the previous high, with the possibility of a Wave IV developing. In the lower part of the chart, a Leading Diagonal followed by a Simple Zigzag has also been ident
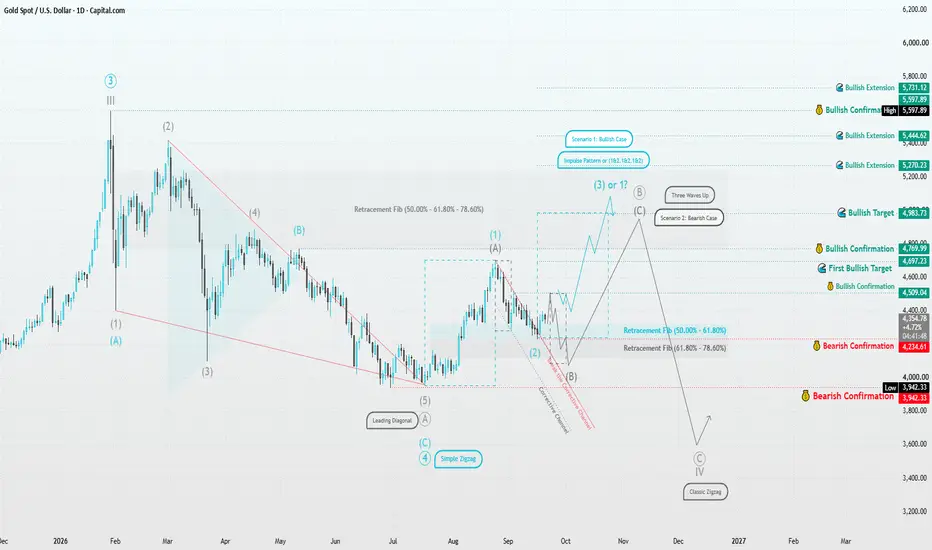
Gold | Structure Before Direction⏱️ Reading Time: ~2 minutes
In the daily timeframe, Gold’s current structure can be viewed from two perspectives. The recent move from around 3,942 may represent the beginning of a new bullish motive structure, while the current decline could potentially be Wave (2) if the 4,234–4,509 area continues to hold.
🔵 Bullish Scenario
What matters is not simply whether price rises, but whether the market develops a valid five-wave motive structure from this area. A move above 4,697, followed by 4,769
DASHUSDT: Weekly Re-Accumulation and Daily Nested Wave 3 Setup⚛️
DASH is one of the stronger higher-timeframe continuation structures on my watchlist.
The weekly chart is holding the W imbalance and the 200 EMA cloud after a major reversal off the lows. That pullback did not destroy the recovery. It created a higher-timeframe re-accumulation zone, and price is now back above the key weekly EMA structure.
Relative strength is also doing its job. DASH is outperforming both BTC and ETH across the short, medium, and longer-term windows. This is not just
Crude Oil | What Is the Current Wave Structure Telling Us?⏱️ Reading time: about 2 minutes
In our previous oil analysis, the main question was:
What structure is the market building?
Now, after a few more days of price action, the internal structure is giving us more information.
In the previous analysis, we looked at the advance as a possible part of a higher-degree Wave III, with 105.80 as an important confirmation level.
In this update, the internal structure is becoming more detailed.
The recent move can now be viewed as a sequence of Wave 1
NQ Weekly Outlook: Crash or Correction? | 21–25 Sep 2026The Fringe Cycles model read for 21–25 September indicates a uniformly negative weekly structure for NQ, with downside pressure present across every stated trading session. The main uncertainty is whether this develops into a more severe breakdown or remains a correction within the broader market structure.
This outlook is based on the NQ Globex session, not just regular cash-session price action. Each daily bias applies approximately from 18:30 Eastern on the previous evening through 15:30 Eas
🇪🇺🇺🇸 EUR/USD | When Structure Reveals the Next Path⏱️ Reading time: about 3 minutes
In this analysis, we are taking a closer look at the EUR/USD structure—especially the movement that developed after the recent historical low, and what price may currently be building at the lower degrees.
From an Elliott Wave perspective, it is not enough for us to simply ask whether price will ultimately move higher or lower. The more important question is:
What structure is the market building right now?
From the major market low, a significant upward move
Ethereum Weekly | One Larger Structure, Two Scenarios⏱️ Reading time: About 3 minutes
On the Ethereum Weekly chart, it helps to step back from the short-term price movements and focus on the larger market structure.
From the beginning of the chart, we can follow a larger impulsive structure, where waves I, II, and III are marked at their respective degree.
After the formation of III, the market entered a more complex corrective period, with several swings developing along the way. The main question now is whether this larger correction is appro
4D chart. What will this show in the next 3 years?3 years from now is a long time. But, what will the moving averages of the 4D chart reveal?
Rather than the 400MA, will it prove that it is influenced primarily by the 200MA? The price: does it dip below, or does it drop? How much time will the current price linger below it?
On the 1D chart, the 400MA is the most telling for crypto. On the 1D chart, the 200MA appears to be most telling for things like "the DOW" and the S&P 500, but I think also the TOTAL3 for Crypto as well.
Mind the averages
How does the Fed Rate (Past & Preset) affect Indexes/Securities?Take a look at Hydra FOMC v1.00
Hydra FOMC v1.00
Use this color-coded indicator to analyze both present and past Fed Rate changes on indexes and securities performances. Want to know what a Fed Rate hike or rate decrease did to the performance of the market/security, then you might want to take a look at this newest indicator.
Highly flexible and customizable with additional pop-up information on inputs, table and labels. There are presets (for multiple Short to Long time periods) t
Bitcoin Daily | The Structure Is Still the Story⏱️ Reading time: About 3 minutes
On the Bitcoin Daily chart, the main question for us is not simply whether price is going up or down.
The more important question is:
What is the current structure telling us?
From the major low marked on the chart, Bitcoin has developed a significant upward move. Now, we are watching one of the most important structural decision points in the market.
Scenario 1: Bullish Case
In the bullish scenario, the current upward move could be part of a larger impulsi
XMR 3 Month Heikin Ashi Trend ChartWe have here a trend outlook chart for Monero on a 3 monthly timeframe (Heikin Ashi candlestick chart). XMR is one of a handful of high market cap coins which have showed signs of strength on a variety of indicators (despite high volatility with various other high market cap coins), including the positive MACD and RSI indicators as shown in this chart.
In addition, there has been significant buy volume in the 170 - 277 price range, as can be seen in the Price-Volume indicator to the right of th
Hyperliquid (HYPE): Is Another Major Cycle Still Ahead?Hyperliquid is one of the few crypto projects where I believe the technical structure and the underlying protocol economics are worth studying together.
On the daily logarithmic chart, HYPE appears to be moving inside a clearly defined long-term ascending channel.
The structure has respected this channel through multiple major market phases, and the current price action is again approaching the upper half of that structure.
I will also publish the same chart in regular scale, because I
4H chart. 400MAGround support on the 4H chart with the 400MA. Reasonably, as we see the market transition from bear to bull, the 400MA will serve as a floor of support.
We will not likely see current prices suddenly unwind and drop below the 400MA as we are in the transition to the bull market. The 200MA (red, thick, solid) just popped over the 400MA. This is a good sign. And this always happens before a bull market, following a bear market. You know, that just might be what a transition is.
If we see curren
1HR Chart view: the 400MAObserve the 400MA (white, thin solid) on the 1H chart. Consider how it has become the the floor. This is a typical arrangement for gaining upward momentum into the larger, bigger picture.
This is a show of strength building towards price increases. Seems like the prices of everything has been going up lately (surely unrelated).
Let's see how things progress over the next 30-90 days.
The 400MA isnt too long for consideration, because the 400MA on the 1H chart is the 100MA on the 4H chart.
I
EUR/USD — Larger Correction or the Continuation of the Bullish T⏱️ Reading Time: ~4 minutes
On the EUR/USD chart, price is currently at an important point within the larger-term structure.
From the 1.60360 peak, a major bearish structure developed into the 0.95356 low. Since then, EUR/USD has produced a significant recovery.
The key question now is whether this recovery is still part of a larger correction, or whether it is developing into the beginning of a larger bullish trend.
🟦 Bullish Scenario — A Larger Uptrend
In the turquoise scenario, the advan
Crude Oil | Is Wave 3 Expanding?⏱️ Reading time: about 2 minutes
In the previous Crude Oil analysis, the main question was:
What kind of structure is the market building?
On this 2-hour chart, the move up from the major low still shows characteristics of an impulsive structure.
In the bullish scenario, this move could be part of a higher-degree Wave 3, and its internal structure is now giving us more clues.
Price is developing a five-wave structure. If this structure continues to unfold as expected and the internal Wave 4
Brent Crude Oil | Is Wave III Expanding?⏱️ Reading time: About 2 minutes
In our previous oil analyses, the focus has always been on one simple question:
What structure is the market building?
On the 2H Brent chart, the move developing from the major low continues to show an impulsive character. Price has now reached an area where the structure may provide much more information about the higher-degree wave.
In the bullish scenario, the current advance could be part of a higher-degree Wave III. If so, the internal structures should
Silver | When Structure Speaks, We Listen⏱️ Reading time: about 3 minutes
In our previous Silver analyses, we focused on identifying the first motive wave to the upside from the recent low — a structure that could develop into a five-wave impulse. After the latest movement, the main question is no longer simply “up or down?” but rather what degree does the current correction belong to, and is it still developing or already complete?
🟦 Scenario 1 | Bullish Case
In this view, the initial bullish structure remains important. The recent
DXY 2H | The Next Structure Will Define the Larger Path⏱️ Estimated Reading Time: About 2 Minutes
Following our daily DXY analysis, we are now moving down to the 2-hour chart to examine what the current movement may be building at the lower degree.
In the bullish scenario, if the recent correction has already completed, the market should now be developing a new Wave 1. Therefore, simply seeing price move higher is not enough. Price needs to break decisively out of the marked black boxes and then develop a valid motive structure.
If that happens,
DXY | When Structure Reveals the Dollar’s Next Path⏱️ Estimated Reading Time: About 2 Minutes
In this update, our focus is on the current DXY structure on the daily chart, where the market is still revealing the pattern following the recent decline.
From the higher-degree perspective, we continue to monitor two scenarios.
🟢 Bullish Scenario
If the current structure completes as a corrective pattern and the market then develops a valid motive structure, the probability of further DXY strength will increase.
A break of the marked levels could