Short
Short
XAU/USD: Gold Breaks Below $4,050 — Are Bears Back in Control?🚨 XAU/USD: Gold Breaks Below $4,050 — Are Bears Back in Control?
🥇 XAU/USD Market Outlook
Gold remains under pressure for a second consecutive session after failing to reclaim the 200 EMA and losing the key $4,050 support level. The combination of surging oil prices, rising Treasury yields, and a stronger US Dollar continues to weigh on the precious metal, while escalating geopolitical tensions provide only limited safe-haven support.
With the FOMC meeting next week, markets are increasingly positioning for a higher-for-longer interest rate environment, leaving Gold vulnerable to further downside unless buyers can reclaim key resistance levels.
🌍 Fundamental Analysis
The macro backdrop has shifted further in favor of the US Dollar as inflation concerns intensify.
🔴 Bearish Drivers
Several major developments continue to pressure Gold:
* The US has now completed its 13th consecutive night of military strikes against Iran, targeting command centers, drone facilities, and maritime infrastructure.
* Iran and its regional allies continue retaliatory attacks across the Gulf, while Houthi forces have expanded their blockade in the Red Sea after striking Saudi oil tankers.
* The simultaneous disruption of the Strait of Hormuz and Bab el-Mandeb—two of the world's most important energy shipping routes—is unprecedented and continues to tighten global energy supply.
* Brent crude has pushed toward $100 per barrel, intensifying concerns over a new wave of inflation.
* US Initial Jobless Claims fell to their lowest level since 1969, reinforcing the view that the labor market remains exceptionally resilient.
* Markets now firmly expect at least one Fed rate hike before year-end, driving Treasury yields higher and supporting the US Dollar.
* President Trump's new tariffs on major trading partners have added another inflationary risk while boosting demand for the USD as a reserve currency.
Together, these factors continue to increase the opportunity cost of holding non-yielding assets like Gold.
🟢 Bullish Drivers
Despite the bearish macro picture, Gold still has several underlying sources of support:
* Geopolitical uncertainty remains extremely elevated.
* Safe-haven demand could accelerate if Middle East tensions continue to escalate.
* A global trade conflict could eventually weaken risk sentiment enough to revive demand for defensive assets.
* Gold remains above the major structural support zone around $4,000, where buyers have previously stepped in.
📈 Technical Analysis (1H)
The attached chart shows a clear deterioration in short-term market structure.
After failing to break above the 200 EMA and rejecting from the $4,155–4,160 resistance zone, sellers regained control and have driven price back below both the 50 EMA and 200 EMA.
Price has now:
* ❌ Broken below $4,050 support
* ❌ Formed lower highs and lower lows
* ❌ Lost bullish momentum following Wednesday's rally
* ❌ Returned to trading inside a short-term bearish structure
Momentum indicators also favor the bears:
* MACD remains below zero, confirming bearish momentum.
* RSI around 41 suggests downside pressure remains dominant without yet reaching oversold conditions.
* The failed recovery from $3,960 now appears to have been corrective rather than the beginning of a broader reversal.
Unless buyers reclaim the moving averages quickly, rallies are likely to be sold.
🔑 Key Levels
Resistance
🟥 4050–4055 – Immediate intraday resistance
🟥 4068 – 200 EMA / major dynamic resistance
🟥 4102 – Previous support turned resistance
🟥 4140–4158 – Major supply zone and recent swing highs
Support
🟩 4030 – Current demand area
🟩 4018–4020 – Near-term support
🟩 4000 – Major psychological level
🟩 3975–3980 – Critical structural support
🟩 3960 – Monthly low
📊 Trading Scenarios
🐻 Bearish Scenario (Preferred)
The technical structure continues to favor sellers while price remains below $4,050.
A sustained break below $4,000 would likely expose:
* 3980
* 3960
* Potential continuation toward deeper structural support if bearish momentum accelerates.
As long as price remains below the 200 EMA, rallies into resistance are likely to attract sellers.
🐂 Bullish Scenario
For buyers to regain control, Gold needs to reclaim:
* 4050
* 4068 (200 EMA)
* 4102
A decisive move back above the $4,155–4,160 resistance zone would invalidate the immediate bearish outlook and shift focus back toward:
* 4180
* 4215
However, this currently appears to be the lower-probability outcome.
📅 Key Market Drivers
Markets will remain focused on:
* 🇺🇸 Ongoing Middle East developments
* 🇺🇸 Federal Reserve expectations ahead of next week's FOMC meeting
* 📈 Treasury yields
* 🛢️ Brent crude oil prices
* 💵 US Dollar Index (DXY)
* 🌍 Trade tariff developments
💵 Cross-Market Watch
* US Dollar Index (DXY): Continues holding near one-month highs, reinforcing downside pressure on Gold.
* Brent Crude: Trading near $100/barrel, keeping inflation fears elevated.
* US 2-Year Treasury Yield: Above 4.35%, reflecting increasingly hawkish Fed expectations.
* Equities: Higher oil prices and concerns over AI-related capital spending continue to pressure broader equity markets, encouraging defensive positioning.
📌 Trading Bias
Bias: Bearish below $4,050
Gold's recent recovery has lost momentum after another rejection from the 200 EMA. The combination of rising oil prices, stronger Treasury yields, resilient US economic data, and a firmer Dollar continues to create a difficult environment for bullion.
While geopolitical tensions should normally support safe-haven demand, inflation fears are proving to be the dominant driver, reinforcing expectations for tighter monetary policy. Unless Gold can reclaim $4,050–4,070, the path of least resistance remains to the downside, with $4,000 acting as the next major battleground for buyers and sellers.
 Short
Short
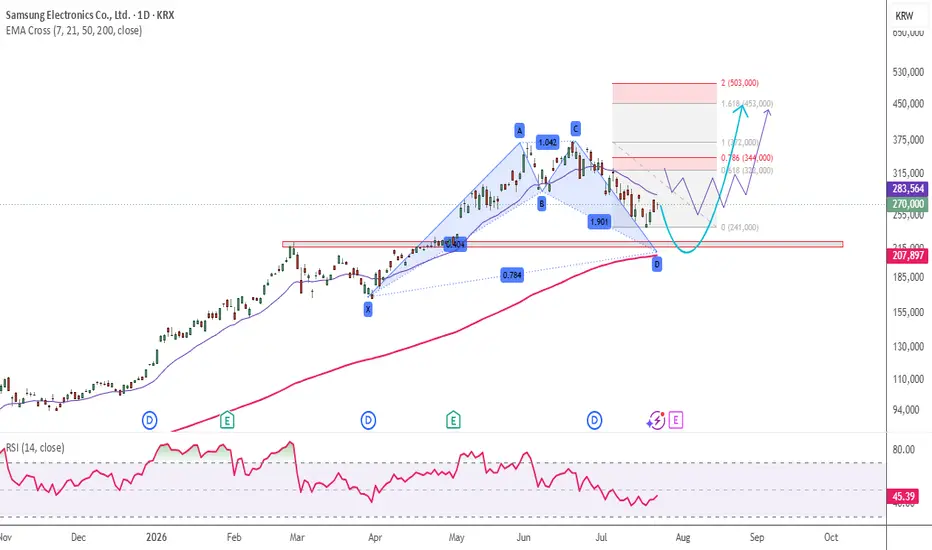
Samsung Electronics : Pullback Before the Next Rally ?KRX:005930 Daily Chart
📈 Key Decision Zone Ahead: Pullback Before the Next Rally? 👀
The stock has staged an impressive recovery after rebounding from the 0.55 Fibonacci retracement zone, confirming strong buying interest from a major technical support area.
However, the next challenge has arrived.
🔍 Technical Outlook
Price is now testing the Daily 20 EMA, which is acting as an immediate resistance level.
A decisive breakout above this dynamic resistance would strengthen the short-term bullish structure, while rejection could trigger a healthy pullback before the next directional move.
⚠️ Watch the Confluence Support
If sellers regain control at the Daily 20 EMA, the stock could retrace toward a high-confluence support zone where multiple technical factors align:
📍 0.786 Fibonacci Retracement
📍 Daily 200 EMA
This confluence creates a potential high-probability demand zone, where buyers may look to re-enter and defend the broader uptrend.
🎯 The Make-or-Break Zone
The 322k–344k price range will be the most important area to monitor in the coming sessions.
This zone is likely to determine the stock's next major move:
✅ Bullish Scenario: A sustained breakout above 344k could confirm renewed momentum and pave the way for a rally toward new all-time highs.
⚠️ Bearish Scenario: Failure to reclaim this resistance may lead to a deeper correction before the broader uptrend resumes.
📊 My View
The longer-term trend remains constructive, but price is approaching a critical technical decision point.
Rather than chasing the current move, I would prefer to watch how price reacts around the Daily 20 EMA and, if needed, the 0.786 Fibonacci + Daily 200 EMA confluence.
Patience here may offer a better risk-to-reward opportunity for the next swing.
Will buyers reclaim control and drive the stock to fresh all-time highs, or is one more correction needed before the next breakout? Share your thoughts below! 👇
🔖 Hashtags
#KOSPI #KoreaStockMarket #KRX #SamsungElectronics #SKHynix #Semiconductor #TechnicalAnalysis #TradingView #PriceAction #MarketStructure #DoubleBottom #EMA20 #EMA200 #Fibonacci #ReverseFibonacci #Breakout #BullTrap #SupportAndResistance #SwingTrading #TrendFollowing #MarketAnalysis #StockMarket #Investing #TradingIdeas #ChartAnalysis #MarketOutlook #WiSHFundManagement  Long
Long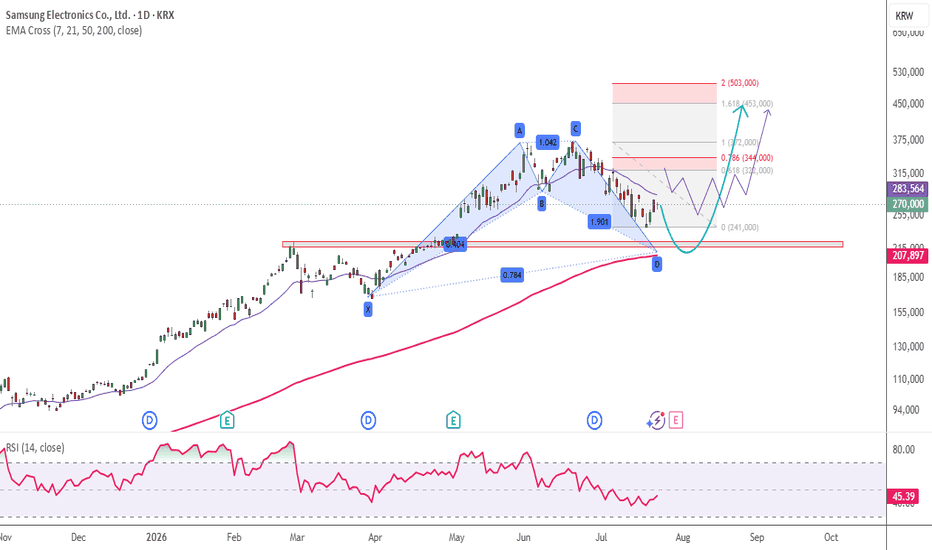
 Short
Short
 Short
Short
Nifty Analysis EOD – 23 July 2026 – Thursday🟢 Nifty Analysis EOD – 23 July 2026 – Thursday 🔴
Band’s Edge: Tests the 23,815 Floor Twice Before Settling at 23,872
🗞 Nifty Summary
Nifty opened with a gap down of 83 points, finding its footing near the key support zone of 23,900. After the opening tick, the index dropped another 31 points before finding a base and gradually climbing towards gap filling. Around 11:00 AM, that gap-filling process completed — and that’s when things got interesting. Constant selling pressure at the day high dragged Nifty nearly 180 points below the IBL, marking a new day low at the support level of 23,815. A recovery of about 80 points followed, but from the IBL again, selling pressure pushed sharply below the day low. The same 23,815 level came to the rescue once more, and another 82-point recovery brought the index to close the day at 23,872.20, with an adjusted close of 23,869.60.
What’s notable is that Nifty tested the bottom of the band created by the 8th July candle — which means we’re still technically inside this range. But it’s looking increasingly fragile. As I write this, Gift Nifty is showing around 140 points down and Brent Crude is up 1.5% from our market close. Another gap down seems likely — we’ll see where we open tomorrow.
The day closed with a bearish candle sitting right at a crucial stage — the real question is whether Nifty can sustain above 23,825 or whether the gap below gets filled. That answer comes tomorrow. One thing I'm keeping in mind though: we're under geopolitical tension right now, and most of what we're seeing on the chart is being driven by news and fear rather than clean technicals. So I don't want to build a bias here — I'll try to stay with the flow, not against it.
🛡 5 Min Intraday Chart with Levels
📉 Daily Time Frame Chart with Intraday Levels
🕯 Daily Candle Breakdown
Open: 23,904.80
High: 23,990.75
Low: 23,807.20
Close: 23,869.60
Change: −126.65 (−0.53%)
🏗️ Structure Breakdown
Type: Bearish candle with recovery wicks — sellers in control but support held twice
Range: ≈ 183 points — moderate volatility
Body: ≈ 35 points — light body reflecting tug-of-war between sellers and buyers near close
Upper Wick: ≈ 86 points — supply stepped in early; the day high didn’t hold long
Lower Wick: ≈ 62 points — demand showed up at 23,815 not once but twice
🛡 5 Min Intraday Chart
⚔️ Gladiator Strategy Update
ATR: 224.19
IB Range: 88.75 → Medium
Market Structure: ImBalanced
Trade Highlights:
09:45 Long Trade: Target Hit (R:R 1:1.68)
11:11 Short Trade: Target Hit (R:R 1:5.44)
Trade Summary: Both trades hit their targets — clean execution, good R:R on the short especially. After two solid wins, I didn't want to give back the gains, so I closed the day early and ignored the further signals the system gave. Sometimes protecting what you've made is the right call.
🧱 Support & Resistance Levels
Resistance Zones: 23,920 | 23,975 | 24,030 | 24,100
Support Zones: 23,835 ~ 23,785 | 23,630
🧠 Final Thoughts
“When the news writes the chart, fighting the tape is just expensive stubbornness.”
Nifty defended 23,815 twice today, and that’s worth noting. Both times the index was pushed below the IBL and both times buyers showed up at the same spot. That kind of double-test at a level usually means something — either it’s strong enough to matter, or the third visit breaks it for good.
Looking at tomorrow, the 23,835 ~ 23,785 zone is the immediate cushion. If that holds through the open, there may be a case for stabilisation. But if Gift Nifty’s 140-point gap down signal plays out, we might open right below that zone — and then the next meaningful support sits further down at 23,630. Resistance up at 23,920 and 23,975 will be the first walls to watch if any recovery attempt happens.
I’ll wait to see how we open before forming any view. A gap-down open into support is not the same as a breakdown — but it’s not something to step in front of without confirmation either. Patience before position tomorrow.
✏️ Disclaimer
This is my personal digital diary and represents my own analysis and point of view. It is not financial advice; please consult a professional advisor before making any trading decisions. Short 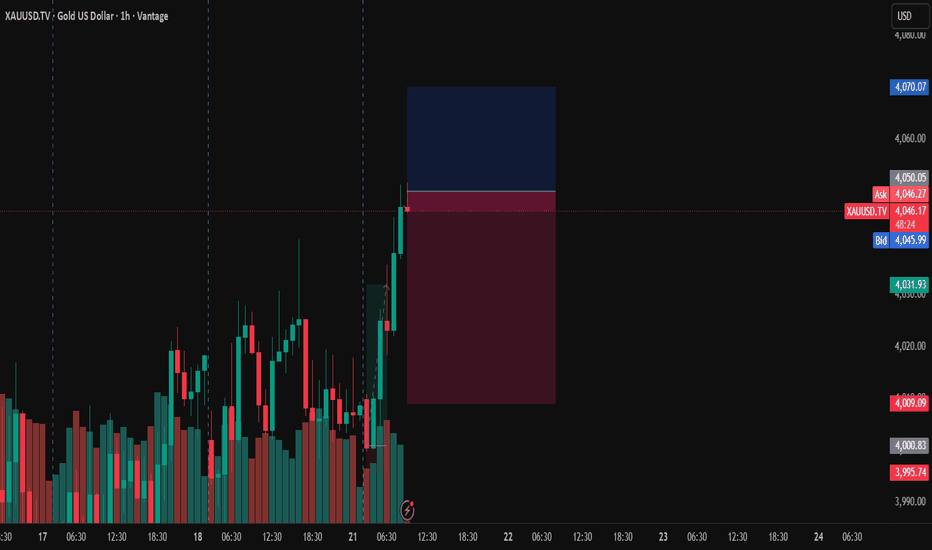
Long 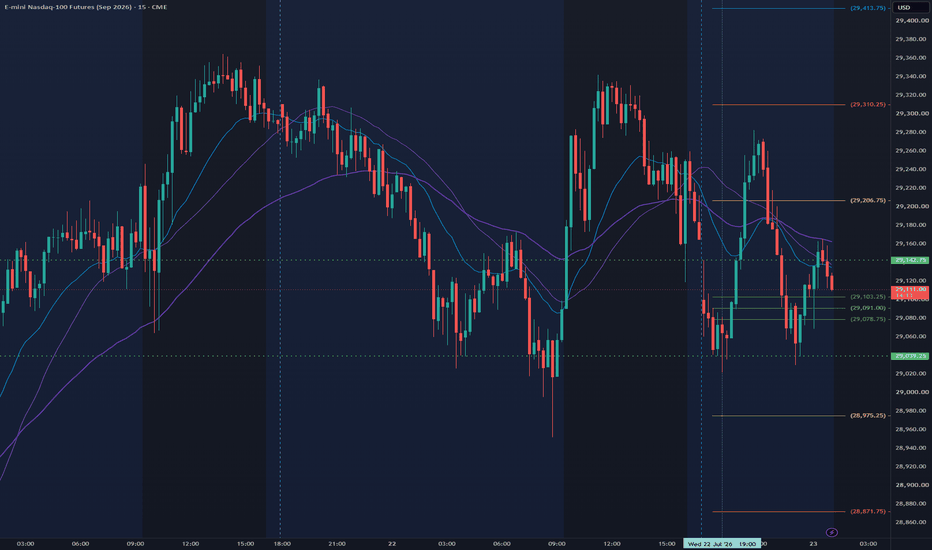
 Long
Long
Short 
 Long
Long

XAUUSD: ABC Pullback May Prepare the Next Bullish Wave
Gold is still holding a constructive bullish structure after the strong recovery from the lower base. From Kelly’s view, the market has already created an impulsive move higher, and the current pullback may simply be an ABC correction before price attempts another upside continuation.
The key idea is simple: gold may correct first, but the bullish structure remains active while price holds above the trendline and the main buy zone.
⟡ Market structure
The chart shows gold recovering strongly from the 3,960 area, then building higher lows along the rising trendline. Price pushed into the 4,130–4,140 region before slowing down, which is normal after a strong bullish leg.
Gold is now trading around 4,118, close to the short-term support area. The first reaction zone sits around 4,100–4,105, where a small buy scalping setup may appear.
The more important zone is the 4,068–4,075 area. This is marked as the possible end of the ABC correction. If buyers defend this zone, gold may start a new upward wave towards the upper trendline and the 4,150–4,160 target area.
➤ Key levels
◌ 4,100–4,105: buy scalping zone and short-term reaction area
◌ 4,068–4,075: main buy zone and possible ABC completion
◌ 4,118–4,123: current price reaction area
◌ 4,130–4,140: nearest resistance zone
◌ 4,150–4,160: upside target and trendline target area
◌ Below 4,068: area where the bullish setup starts to weaken
⌁ Elliott Wave view
From an Elliott Wave perspective, gold appears to have completed a short bullish wave sequence from the lower base. After that, the current movement may be forming an ABC correction.
Wave A is the first pullback from the recent high.
Wave B may form a small rebound around the 4,100 zone.
Wave C may complete around 4,068–4,075 if price continues to correct deeper.
If wave C ends inside this buy zone and a bullish confirmation candle appears, gold may begin the next continuation phase. The next target would be 4,130–4,140 first, then 4,150–4,160 if momentum expands.
▸ Trading scenario
Preferred scenario: wait for gold to complete the ABC correction around the buy zone before looking for continuation.
Entry zone: 4,068–4,075 if bullish confirmation appears
Scalping entry zone: 4,100–4,105 only if price reacts strongly
Stop loss: below the confirmed wave C low or below 4,060
Take profit 1: 4,130–4,140
Take profit 2: 4,150–4,160
Take profit 3: higher trendline area if bullish momentum continues
Alternative scenario: if gold breaks below 4,068 with strong bearish pressure, the ABC bullish setup weakens. In that case, price may need to form a deeper base before the next recovery becomes reliable.
⌁ Kelly’s view
For Kelly, this is a bullish continuation structure, but the market needs a healthy correction before the next strong move. Buying directly after a strong push is not the cleanest plan.
The better setup is to wait for gold to pull back into support, then watch whether buyers defend the ABC completion zone.
Gold is correcting inside a bullish structure.
If the buy zone holds, the next upside wave may continue towards 4,150–4,160.
Share your view below.
Long 
 Long
Long
 Short
Short
Yanbu National PetroChem : Is the Next Leg Up Forming ?TADAWUL:2290
📈 EMA 200 Retest + Bullish Divergence: Is the Next Leg Up Forming?
Price is now approaching the 200-week EMA at 34.23—a level that has historically acted as a major decision zone.
Looking at previous price behavior, the asset has repeatedly struggled to sustain above the 200-week EMA and experienced significant pullbacks around:
🔹 July 2023
🔹 October 2024
🔹 September 2025
🔹 April 2026
However, the current setup is showing some important differences.
The weekly chart has formed a bullish divergence, followed by a strong recovery. From the previous week's high, price advanced approximately 43%—while the weekly low-to-high measurement represents a total move of nearly 61%.
Following that advance, price once again failed to sustain above the 200-week EMA and entered a corrective phase, eventually declining toward 29.
This level is particularly significant as it represents the 0.618 Fibonacci retracement zone of the major swing from 24 to 38.7—a classic discounted accumulation area.
💡 Why this setup is interesting:
In my experience, the combination of:
✅ Bullish weekly divergence
✅ Formation of a higher low
✅ Price holding above the 200-week EMA
✅ A confirmed discounted Fibonacci retracement
✅ Positive market structure
can create a powerful confluence for the next potential expansion phase.
Using the Fibonacci Extension tool, the initial upside projections currently point toward:
🎯 43
🎯 52
These levels represent the first major upside objectives if the bullish structure remains intact and price successfully sustains above the key EMA 200 zone.
📌 The key question now is not whether price can rally—but whether it can finally sustain above the 200-week EMA.
📌 In case of rejection from Ema200, price may reverse towards 27-26 price zone.
A successful breakout and hold could significantly strengthen the bullish continuation case.
⚠️ As always, this is a technical analysis perspective—not financial advice. Key support and invalidation levels should be monitored closely.
#TechnicalAnalysis #PriceAction #BullishDivergence #EMA200 #Fibonacci #FibonacciRetracement #FibonacciExtension #HigherLow #MarketStructure #SwingTrading #TrendAnalysis #StockMarket #TradingIdeas #TradingView #Investing #TechnicalTrading #Breakout #BullishSetup #MomentumTrading #LongTermInvesting #TradingStrategy  Long
Long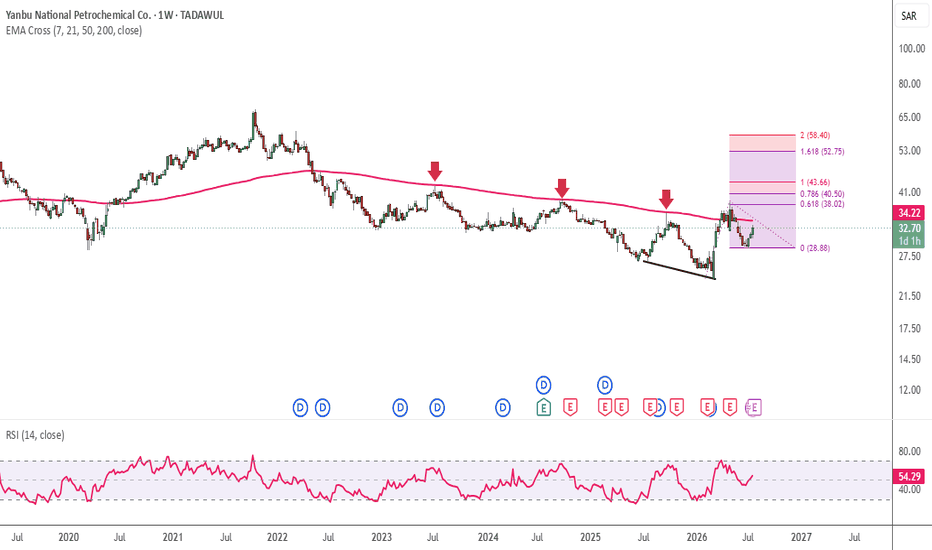
 Short
Short