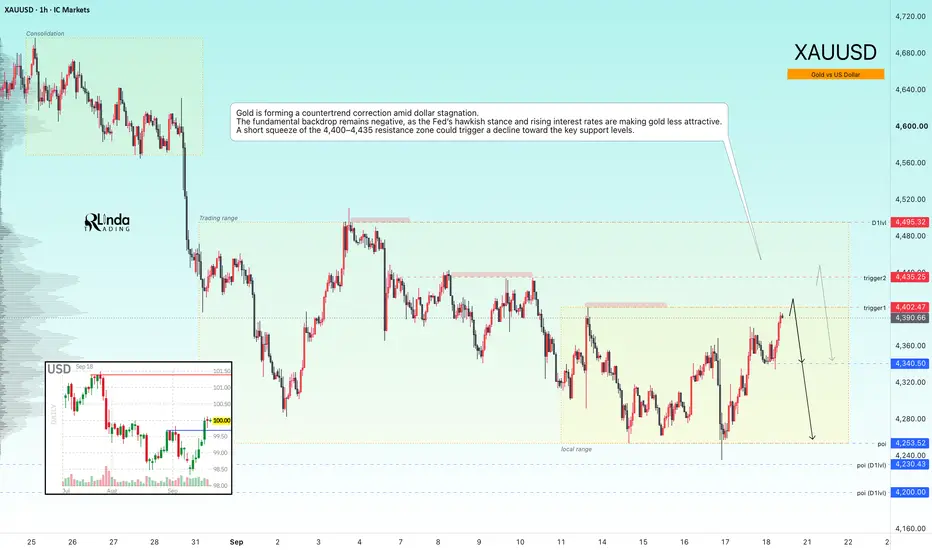
GOLD - A countertrend correction aimed at liquidity huntingICMARKETS:XAUUSD has been forming a countertrend correction toward the 4,400–4,430 liquidity zone since the session opened. The fundamental backdrop remains weak, and the market is still in a bearish trend
The dollar is stagnating after breaking through local resistance levels. The Fed’s hawkish stance and rising rates are supporting the Dollar Index, which is putting medium-term pressure on the metals market. However, the correction in oil prices is giving gold some room to recover as it tests key levels.
Gold is stabilizing, but further upside remains limited by the Fed’s hawkish outlook and geopolitical risks. The BOJ decision and developments in the Middle East will determine the short-term direction
Drivers:
Upside: further declines in oil prices and yields, de-escalation of the conflict, softer U.S. data, dovish BOJ.
Downside: escalation in the Middle East, higher oil prices, hawkish Fed stance, dollar strength
Resistance levels: 4,402, 4,435, 4,495
Support levels: 4,340, 4,253, 4,200
Gold is forming a countertrend correction amid dollar stagnation. A short squeeze of the 4,400–4,435 resistance zone — with the key focus on two triggers — could trigger a decline toward the key support levels. The formation of reversal patterns after the retest could provide a potential entry opportunity
Best regards,
R. Linda!  Short
Short
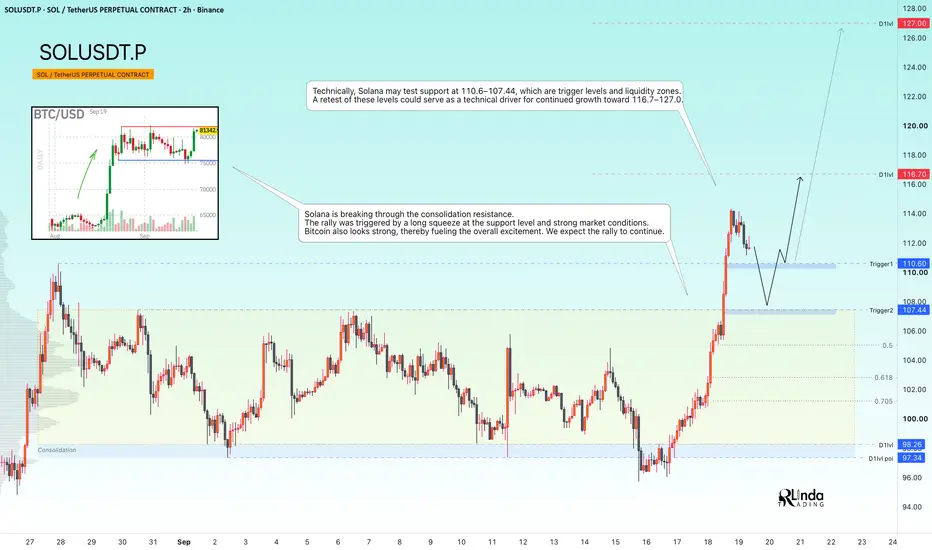
SOLUSDT - A hunt for liquidity ahead of the rally's continuationBINANCE:SOLUSDT confirms its bullish market structure. The long squeeze of support that we expected in the previous analysis played out perfectly. The bulls quickly took control of the situation and strengthened their positions...
Previously, we discussed how the market turned out to be stronger than expected: Bitcoin showed virtually no reaction to higher interest rates, the Fed’s hawkish stance, or the fact that the CLARITY Act was not passed. Consolidation continued, which further confirmed the strength of the market.
As for Solana, the altcoin is breaking through the consolidation resistance, suggesting that the coin is ready to continue its move higher. The rally was triggered by a long squeeze of support and the overall strength of the market
Resistance levels: 116.7, 127.0
Support levels: 110.6, 107. 44
Technically, Solana could retest the 110.6–107.44 support zone, which represents both key triggers and liquidity areas. A retest of these levels could become a technical catalyst for further upside toward 116.7–127.0
Best regards,
R. Linda!  Long
Long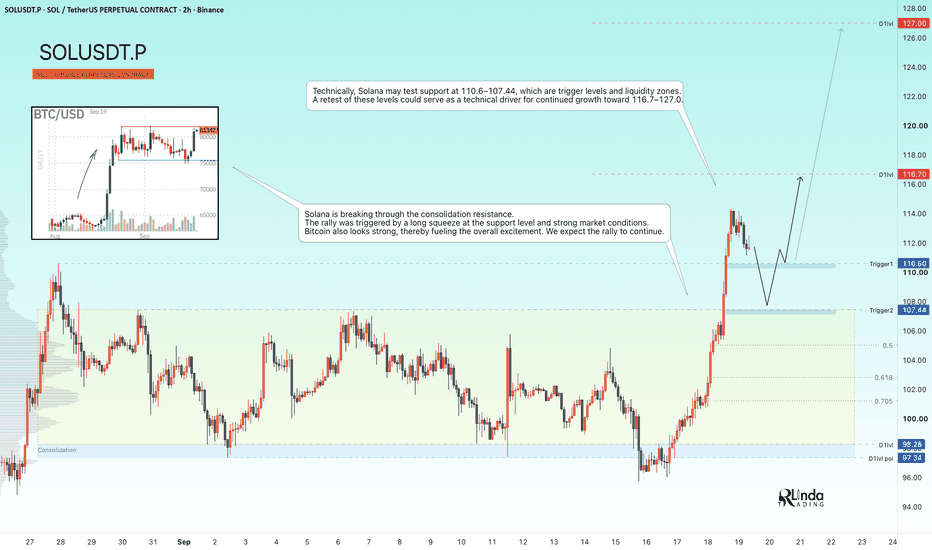
XAUUSD Weekly Outlook — Breakout Needs a Retest
Gold is sitting around 4,378 after breaking the H4 descending trendline.
The structure is improving, but price is now testing the 4,385–4,405 immediate resistance area.
The simple read
A pullback toward 4,290–4,320 would be the cleaner test for buyers.
If this zone holds, Gold may recover toward 4,400 first, followed by the major 4,485–4,510 resistance.
A clean break above 4,510 could later expose the H4 resistance around 4,630.
If 4,290 fails, the major swing support near 4,235 becomes important again.
Key price zones
4,385–4,405 — immediate resistance
4,290–4,320 — key pullback support
4,235 — major swing low
4,485–4,510 — major resistance
4,630 — H4 resistance
The trendline break is encouraging, but I prefer a retest before continuation.
Do not chase the breakout.
Wait for the zone.
Can buyers defend 4,30x and open the path toward 4,500? Long 
 Long
Long
SOLUSDT - The Hunt for Liquidity Before Growth Resumes BINANCE:SOLUSDT.P continues to consolidate, just like the rest of the market. Technically, this is a favorable sign for further upside. However, important news is ahead...
Bitcoin is in consolidation, as is the rest of the market. Key news is ahead: the FOMC meeting and consideration of the cryptocurrency legislation.
Solana is also consolidating, while at the same time maintaining its local bullish trend amid expectations of upcoming news. Technically, a liquidity pool has formed below 97.34, which could be tested before a rally higher.
A long squeeze of the current range support could trigger further upside. However, a breakdown of the market structure on negative news could lead to a broader market decline
Resistance levels: 103.88, 107.4
Support levels: 98.3 - 97.3
A favorable fundamental backdrop, a false breakdown of support, and price consolidation above 98.3 could become a technical catalyst for further upside toward 103.88–107.4–110
Best regards,
R. Linda! Long 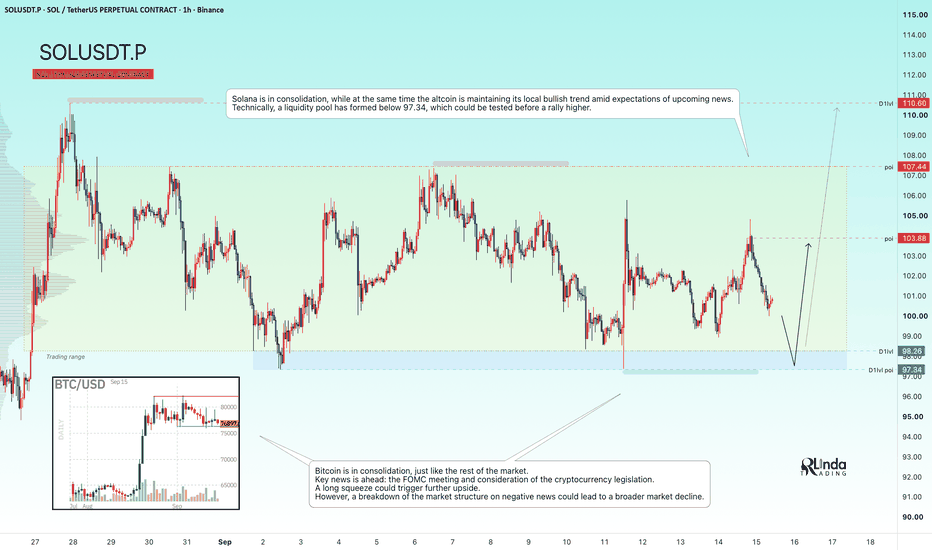
 Long
Long
GOLD - The Hunt for Liquidity Ahead of a Decline ICMARKETS:XAUUSD continues to form a countertrend correction, driven by the decline in oil prices. The fundamental backdrop remains weak...
The dollar is stagnating after a strong rally triggered by the Fed’s hawkish stance and rising interest rates. However, the Dollar Index remains strong, which continues to put pressure on gold. At the same time, the decline in oil prices has given the metal some room to recover. The market remains highly dependent on geopolitical developments.
There is not much major news ahead next week, with the key focus on PMI data and Friday’s Durable Goods Orders. Technically, gold remains under pressure from the bearish trend
Resistance levels: 4,402, 4,434, 4,511
Support levels: 4,340, 4,250, 4,200
Gold is forming a countertrend correction. The dollar remains strong, while the fundamental backdrop is unfavorable for gold due to the Fed’s hawkish stance and rising interest rates.
Technically, the key focus is on two triggers: 4,402–4,434. A short squeeze could trigger a decline toward 4,340–4,250
Best regards,
R. Linda! Short 
Bearish Liquidity Sweep Setting Up Bullish Reversal Toward BSL?1. Overall Bias
The chart presents a Smart Money Concepts (SMC) / ICT-style technical analysis, outlining a full market cycle: consolidation → liquidity sweep → bearish expansion → reversal → retracement → renewed bullish setup targeting higher liquidity pools.
2. Element-by-Element Breakdown
A. Price Range (Aug 25–28)
Labeled "PRICE IN RANGE" — price consolidated in a tight horizontal box, indicating accumulation/distribution before a directional move.
A diagonal trendline inside this box shows minor internal structure (lower highs) hinting at seller pressure building before the breakdown.
B. MSS (Market Structure Shift) — Aug 28–29
As price broke below the range's low, it triggered a Market Structure Shift, confirming a change from ranging/bullish structure to a bearish directional bias.
This is the first technical confirmation that sellers had taken control.
C. First Fair Value Gap (FVG) — Post-MSS
Immediately after the MSS, an aggressive bearish candle created an imbalance (FVG) around the 4,480–4,520 zone (grey box).
This zone represents inefficient price delivery — a gap between buying and selling pressure — and is technically considered a potential resistance/rebalancing zone if price later revisits it.
D. Bearish Move (Fundamentally Driven)
The information box explicitly states this decline was triggered by FOMC fundamentals — implying a hawkish Fed outcome strengthened the USD, which inversely pressured Gold lower.
Price dropped sharply from ~4,520 down to ~4,300, marked clearly as "BEARISH MOVE."
E. Sell-Side Liquidity & Liquidity Sweep (Sep 1–2)
Price declined into a zone marked "SELL SIDE LIQUIDITY," where resting sell-stop orders (from range lows) were sitting.
The "LIQUIDITY SWEEP" label confirms price deliberately wicked below this level to grab liquidity (stop-hunt) before reversing — a hallmark SMC behavior where smart money engineers a move to fill large orders before reversing direction.
F. Second Fair Value Gap (FVG) — Recovery Leg
Following the sweep, an impulsive bullish leg formed a second FVG around 4,360–4,400.
This becomes a key support/Point of Interest (POI) zone, since price often retraces to fill such imbalances before continuing its intended direction.
G. Buy-Side Liquidity Sweep (Sep 3–4)
Price rallied aggressively into the "BUY SIDE LIQUIDITY" zone near 4,500–4,520, sweeping resting buy-stop orders above the prior swing highs.
This effectively completed a full liquidity cycle: sell-side sweep → bullish expansion → buy-side sweep.
H. Distribution / Bearish Retracement Channel (Sep 4–16)
After the liquidity grab, price entered a descending channel (marked by the diagonal trendline), retracing lower in a controlled, corrective structure.
This pullback is technically significant — it's retracing back into the FVGs/POIs created earlier, which is standard behavior for price to "rebalance" imbalanced zones before resuming its higher-timeframe direction.
I. Key POIs (Points of Interest) — Right Side of Chart
Three horizontal POI zones are marked as upside targets:
POI Approx. Level Significance
POI 1 ~4,520 Highest target, aligned with prior buy-side liquidity high
POI 2 ~4,480 Mid-range resistance/imbalance zone
POI 3 ~4,400 Nearest target, aligned with the FVG left during the bullish leg
These POIs represent untapped liquidity/imbalance zones above current price, forming the bullish thesis's technical targets.
J. Bullish Reversal (Sep 16–17, Current Price Action)
Price recently swept a fresh low (~4,240) and sharply reversed upward, labeled "BULLISH REVERSAL."
This is interpreted as another localized liquidity sweep, now acting as the launchpad for the anticipated move back toward the POIs.
Current price (4,308.50) is trading right at the edge of this reversal structure, suggesting the setup is actively developing, not yet confirmed.
K. Inset Chart (Bottom Left) — DXY (U.S. Dollar Index) Correlation
A smaller secondary chart, styled with candlesticks around the 99.90–100.30 range, appears to track the U.S. Dollar Index (DXY).
The upward-sloping arrow suggests an expected continuation or reversal in DXY that would inversely correlate with Gold's move — i.e., if DXY weakens from here, Gold gets fundamental tailwinds to reach the marked POIs.
This ties directly into the chart's core thesis (bottom text box): "The U.S. Dollar moved higher fundamentally due to FOMC data. Now, a downside move may occur. If USD weakens, Gold could move upward and target the key POIs."
3. Trade Thesis Summary
Catalyst: FOMC-driven USD strength caused Gold's initial bearish leg.
Liquidity Engineering: Price swept both sell-side and buy-side liquidity in sequence — a classic smart-money footprint.
Current Phase: Retracement/distribution phase is complete or nearing completion, with a fresh bullish reversal signal at the recent low.
Forward Expectation: Contingent on USD weakness, Gold is technically positioned to reclaim liquidity toward POI 3 → POI 2 → POI 1 (4,400 → 4,480 → 4,520+).
Invalidation Risk: If the USD continues strengthening or the bullish reversal fails to hold above recent lows (~4,240), the bearish channel could resume, delaying or invalidating the bullish POI targets. Long 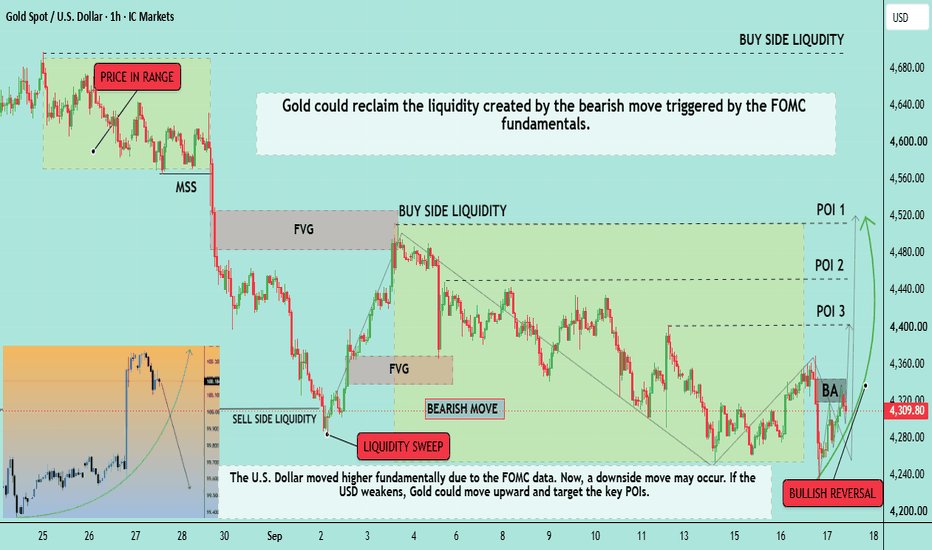
XAUUSD — Breakout Is Done, Can 4,317 Hold?
Gold is trading around 4,337 after a strong M30 recovery from the 4,278 area.
Price has pushed back above the previous short-term structure and is now holding above the breakout zone near 4,317.
The recovery is encouraging, but the market is approaching an important Fed decision.
Rate expectations remain elevated, Treasury yields are still near 5%, and the U.S. dollar remains firm. Gold has still managed to recover, showing that buyers are not completely giving up control.
But a breakout candle alone is not enough.
The retest is the real test.
The simple read
M30 has started to shift away from the previous bearish structure.
Gold first reacted from the 4,278 OB area and then built a strong bullish leg back above 4,317.
That level now changes role.
Instead of resistance, 4,317 becomes the first breakout support buyers need to defend.
The current price near 4,337 is already around the 0.786 Fibonacci area of the latest recovery leg, so I would not chase the move here.
The cleaner setup would be a controlled pullback.
If Gold returns toward 4,317 and buyers defend the zone, the bullish recovery structure remains healthy.
The first upside test is around 4,354.
This is the nearest visible resistance and the first level where short-term sellers may react.
If buyers can break and hold above 4,354, the next important area becomes 4,390–4,400, with 4,396 as the major resistance decision level.
Above that sits the larger 4,425–4,431 upper resistance zone.
That is where the recovery would face a much stronger test.
Key price zones
Current price area: 4,337
Breakout support: around 4,317
Order Block support: around 4,278
Major structure support: 4,253–4,258
First resistance test: around 4,354
Major resistance: around 4,396
Upper resistance: around 4,431
Bullish pressure improves above: 4,354
Recovery structure weakens below: 4,317
Trading plan
Buy reaction scenario
If Gold pulls back toward 4,317:
I will watch whether buyers can defend the breakout structure.
A clean rejection, slowing downside momentum or a strong reclaim from this area can support another bullish leg toward 4,354.
If 4,354 then breaks and holds, attention can shift toward 4,396.
The important point is not to chase price at 4,337.
Wait for the retest.
Sell reaction scenario
If Gold reaches 4,354 but cannot hold above it:
A short-term rejection may rotate price back toward 4,317.
This would not automatically destroy the recovery structure as long as breakout support continues to hold.
The larger seller test remains around 4,396.
Breakout scenario
If Gold clears 4,354 with strong acceptance:
The M30 recovery becomes more convincing.
4,396 becomes the next major target and decision zone.
A clean break above 4,396 could then expose the upper resistance around 4,431.
Breakdown scenario
If 4,317 fails with clear bearish continuation:
The breakout loses quality.
I would then watch the 4,278 OB as the next important buyer reaction area.
Below that, 4,253–4,258 remains the major structure support.
The short-term structure is improving.
But the easy part of the bounce may already be behind us.
4,317 is the level buyers need to protect.
4,354 is the first seller test.
4,396 is the major breakout decision.
4,431 is the upper recovery objective.
Long 
GOLD - A countertrend correction ahead of the news ICMARKETS:XAUUSD is bouncing from support ahead of the news and forming a countertrend correction amid the dollar’s stagnation following a five-day rally. The FOMC meeting and comments from the regulator are ahead...
Technically, most of the hawkish risks have already been priced in, but gold will remain vulnerable if the Fed signals that it intends to keep rates elevated for an extended period. Geopolitical risks and high energy prices are providing support. Gold is caught between expectations of tighter monetary policy and safe-haven demand.
Technically, the market is moving toward a liquidity zone, which could be tested before another decline within the local trend
Drivers:
Downside: hawkish Fed, strong dollar, rising yields.
Upside: dovish Fed, weak dollar, geopolitical support
Resistance levels: 4,355, 4,402
Support levels: 4,250, 4,230, 4,200
Gold, having failed to reach the key levels at 4,230–4,200, is forming a countertrend correction ahead of the upcoming news — the interest rate decision. A short squeeze of the 4,355–4,400 resistance zone could trigger a decline toward the key areas of interest
Best regards,
R. Linda! Short 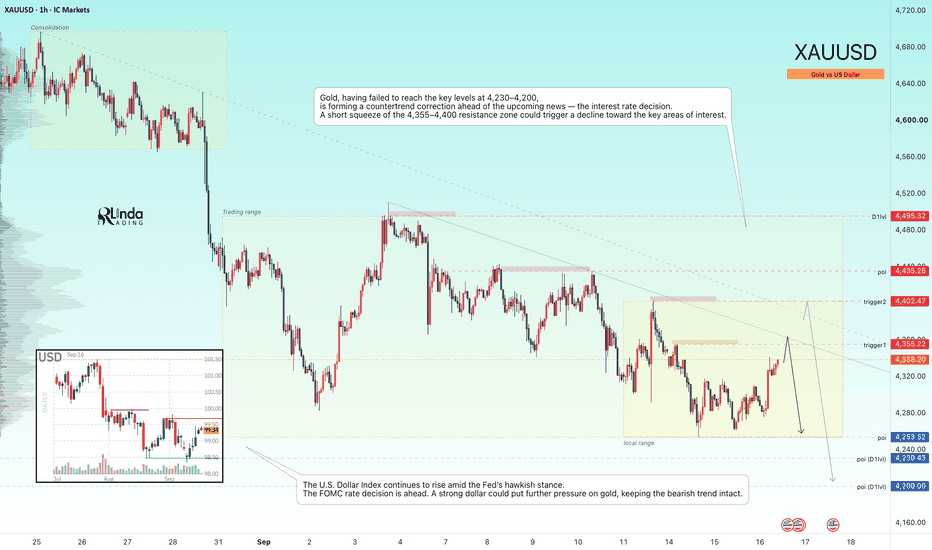
 Long
Long
XAUUSD — 4,257 Hold or 4,214 Sweep?
Gold is trading around 4,273 after extending the M30 decline below yesterday’s reaction support.
Price remains under the descending trendline, while the latest recovery attempt failed to create a meaningful structure shift.
Macro pressure is also still heavy ahead of the Fed decision, with elevated yields, a firm dollar and higher oil prices keeping Gold under pressure.
But price is now moving closer to the lower reaction zones.
And this is where chasing the sell becomes less attractive.
The reaction is the signal.
The simple read
M30 structure remains bearish below the descending trendline.
The latest bounce reached the 4,31x area but failed below the major resistance zone around 4,319.
Price has now moved back below the 0.618 Fibonacci level near 4,277 and is approaching the 0.786 area around 4,267.
The first important support sits around 4,253–4,257.
This area combines the previous swing low, Fib completion and visible reaction demand.
A clean buyer response here could create a temporary recovery.
But support is not an automatic buy.
If 4,257 fails, the chart leaves room for a deeper liquidity sweep toward 4,214.
That lower zone aligns closely with the 1.618 Fibonacci extension and is the stronger downside reaction area on this M30 structure.
On the upside, 4,285 is the first small recovery test.
The bigger level is still 4,319.
This area combines resistance with the descending trendline and remains the key seller decision zone.
Key price zones
Current price area: 4,273
Immediate Fibonacci reaction: 4,267–4,277
Main support / buy reaction zone: 4,253–4,257
Deeper liquidity zone: around 4,214
First recovery resistance: around 4,285
Main resistance + trendline: around 4,319
Major upper supply: around 4,398
Trading plan
Buy reaction scenario
If Gold reaches 4,253–4,257:
I will watch for sellers to lose momentum and buyers to show a clear reaction.
A confirmed recovery can first reopen 4,277–4,285.
If price then breaks the descending trendline, 4,319 becomes the next important test.
But I will not buy simply because price touches support.
Sell reaction scenario
If Gold recovers toward 4,285 or especially 4,319 and rejects:
The bearish M30 structure can remain intact.
A failed recovery may send price back toward 4,257.
Breakout scenario
If Gold breaks the trendline and can hold above 4,319:
The short-term structure changes significantly.
That would improve the recovery case and shift attention toward the higher resistance zones.
Breakdown scenario
If 4,257 cannot hold:
I would watch for the deeper liquidity move rather than chase the breakdown.
The next major reaction zone becomes 4,214.
A sweep into that area followed by a strong reclaim could create a much cleaner recovery structure.
The trend is still bearish.
But price is getting closer to support.
4,257 is the first buyer test.
4,214 is the deeper liquidity test.
4,319 is the real recovery confirmation level. Long 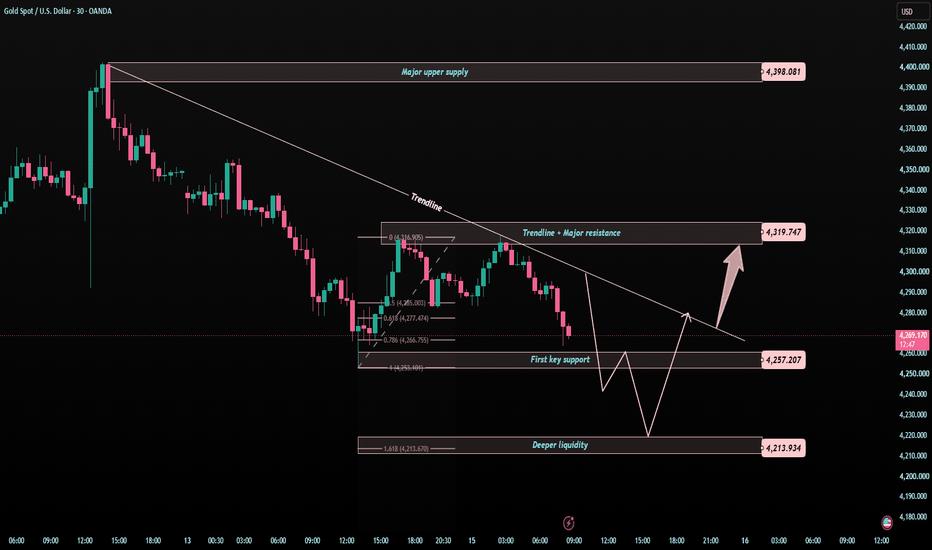
NVDA – Silver Reclaimed, Bronze Frontier Active | CSE Option OSDate: 2026-09-15
Type: CSE Option Decision OS Update
NVIDIA is currently another important live case inside our CSE Capital — Option Decision OS, also known as the Continuation Swing Engine.
The current NVDA dashboard gives a very clear message: the thesis is intact, the trend remains bullish, and the tactical repair has been reclaimed. At the same time, CSE still refuses to treat that as an automatic buy or aggressive add. The system keeps NVDA in HOLD / ADD WATCH, with every next step filtered through feasibility and risk.
That distinction is exactly why we built the CSE Option Decision OS.
A normal chart view might simply say: “NVDA is strong again” or “NVDA is bullish.” But for options and structured capital allocation, that is not enough. CSE separates the underlying thesis, the tactical repair, the current entry frontier, the add status, the option position, the roadmap and the risk gate.
The current CSE read for NVDA:
Manual Action: HOLD / ADD WATCH
Underlying Thesis: THESIS INTACT
Tactical Status: TACTICAL REPAIR RECLAIMED
Add Status: EVALUATE RANGE — FEASIBILITY REQUIRED
Option Position: HOLD
Signal Confidence: 72/100
Decision Price / Current Quote: 211.99
Trend: Bullish
Next Zone: 220.78
Decision Mode: Manual Only
Execution: Locked / Disabled
This is a strong but disciplined read.
The most important structural detail is that NVDA has already reclaimed the Silver Current Entry Frontier, while the current price is now trading inside the Bronze Current Entry Frontier.
The Current Entry Frontier currently shows:
Entry State: SILVER RECLAIMED
Thesis Health: INTACT
Tactical Status: SILVER RECLAIMED
Add Status: EVALUATE RANGE — FEASIBILITY REQUIRED
Gold Range: 167.39 – 174.29
Function: Retest Support
Silver Range: 186.88 – 197.66
Function: Retest Support
Bronze Range: 208.42 – 219.75
Function: BREAKOUT_ACCEPTED
That means NVDA is no longer sitting in the deeper recovery area. It has already moved through that phase. The stock reclaimed Silver, maintained thesis health, and is now trading within the Bronze breakout-accepted zone. At the current quote around 211.99, NVDA is structurally strong, but it is also approaching the next important decision area rather than sitting at a deeply discounted entry.
That is why CSE says HOLD / ADD WATCH instead of “buy blindly.”
This is the unique strength of the system.
The thesis and the entry are not treated as the same thing.
A stock can have:
- an intact thesis,
- a bullish trend,
- a reclaimed tactical structure,
- accepted higher entry frontiers,
and still not qualify as a clean automatic option entry.
That is the difference between structured decision support and emotional trading.
The Structural Authority Ladder gives the deeper framework behind the current NVDA setup:
Tactical Failure: 168.68
Tactical Repair: 173.54
Macro Survival: 136.45
Hard Thesis Invalidation: 110.41
The Macro Fib Thesis Lens confirms the broader continuation structure:
Position Archetype: Bullish Continuation
Macro Fib Status: Certified Structural Thesis — Intact
Macro Survival Support: 136.45
Tactical Repair Trigger: 173.54
Distance to Macro Support: +55.4%
Distance to Repair Trigger: +22.2%
Decision Posture: Evaluate Range — Feasibility Required
Reclaim Required: False
No Add Zone: False
Manual Only: True
Order Ready: False
That combination matters.
Reclaim Required: False.
No Add Zone: False.
Order Ready: False.
So structurally, NVDA is allowed to stay on add watch, but the system still refuses to authorize a trade automatically. That is exactly what we want CSE to do.
The roadmap now points to the next zone around 220.78. Beyond that, the broader structure includes higher roadmap layers and continuation potential, but CSE does not jump ahead emotionally. First, the stock must prove how it behaves near the active Bronze frontier and the next zone.
This is where the process becomes practical.
NVDA is bullish.
The thesis is intact.
Silver has been reclaimed.
Bronze is active.
But the next decision still requires feasibility.
That means every option idea still has to pass the Option Feasibility + Risk Gate:
premium, strike, expiry, delta, implied volatility, liquidity, bid/ask spread, time value, portfolio exposure and concentration risk.
The stock can pass the structural test while the option itself still fails the feasibility test.
That is one of the main reasons we developed CSE Capital — Option Decision OS.
Our current NVDA interpretation is therefore:
The thesis is intact.
The trend is bullish.
Tactical repair has already been reclaimed.
Silver has been reclaimed.
Price is now trading inside the Bronze Current Entry Frontier.
The next zone sits around 220.78.
Existing exposure remains HOLD.
Additional exposure remains on WATCH.
Any new option decision still requires full feasibility review and manual approval.
This is not prediction.
This is not hype.
This is not a blind buy signal.
This is structured option decision support.
Structure first.
Confirmation second.
Feasibility third.
No chase, no emotion, only process.  Long
Long
AMZN – Breakout Retest At Bronze Frontier | CSE Option Decision Date: 2026-09-15
Type: CSE Option Decision OS Update
Amazon is currently showing exactly the type of setup for which we built the CSE Capital — Option Decision OS, also known as the Continuation Swing Engine.
The broader AMZN thesis remains intact and the trend remains bullish, but the interesting part is what is happening underneath the headline trend.
CSE currently classifies Amazon as a Breakout Retest.
That distinction matters.
AMZN has already reclaimed the deeper structural levels, moved through the Silver framework, and recently traded inside our Bronze Current Entry Frontier. The latest validated completed close was around 253.56, inside the Bronze range of 249.40–257.55.
The current quote around 248.15 is now sitting just underneath the lower boundary of that Bronze range.
In other words: we are not looking at a random pullback. We are watching whether a previously accepted breakout region can now behave as a continuation / retest area.
The current CSE Executive Signal reads:
Manual Action: HOLD / ADD WATCH
Underlying Thesis: THESIS INTACT
Tactical Status: TACTICAL REPAIR RECLAIMED
Add Status: EVALUATE RANGE — FEASIBILITY REQUIRED
Option Position: HOLD
Signal Confidence: 94/100
Decision Price / Current Quote: 248.15
Trend: Bullish
Decision Mode: Manual Only
Execution: Locked / Disabled
Again, this is precisely why CSE is not designed as a simple green/red signal generator.
Amazon can have:
A bullish trend.
An intact thesis.
A reclaimed tactical structure.
A very high signal confidence.
And CSE can still refuse to say “buy now.”
Instead, the system says:
HOLD / ADD WATCH.
EVALUATE RANGE.
FEASIBILITY REQUIRED.
That is a much more useful decision state for an options trader.
The Current Entry Frontier gives us another layer of context.
Gold Range: 158.85–163.91
Function: Retest Support
Confidence: 91
Silver Range: 193.47–201.67
Function: Retest Support
Confidence: 94
Bronze Range: 249.40–257.55
Function: BREAKOUT_ACCEPTED
Confidence: 94
The important observation is that AMZN has already reclaimed Silver and has been accepted into the Bronze breakout architecture.
The current price is now testing that Bronze boundary.
This is where we stop predicting and start observing.
If AMZN can reclaim and hold the 249.40–257.55 region again, the continuation case becomes stronger. If the stock fails to stabilise there, CSE does not force an add simply because the long-term thesis remains bullish.
That separation between THESIS and ENTRY is fundamental to the CSE Option Decision OS.
A bullish thesis answers:
“Do we still believe the larger structure is alive?”
The Entry Frontier answers:
“Is this actually an intelligent place to increase exposure?”
Those are not the same question.
The Structural Authority Ladder gives us the deeper hierarchy behind the AMZN thesis:
Tactical Failure: 184.27
Tactical Repair: 189.16
Macro Survival: 151.83
Hard Thesis Invalidation: 125.61
The Macro Fib Thesis Lens currently classifies AMZN as:
Position Archetype: Bullish Continuation
Macro Fib Status: Certified Structural Thesis — Intact
Macro Survival Support: 151.83
Tactical Repair Trigger: 189.16
Distance to Macro Support: +63.4%
Distance to Repair Trigger: +31.2%
Decision Posture: Evaluate Range — Feasibility Required
Reclaim Required: False
No Add Zone: False
Order Ready: False
That last combination is important.
Reclaim Required: False.
No Add Zone: False.
But Order Ready: False.
In other words, the structural thesis allows us to evaluate additional exposure, but it still does not authorize an automatic trade.
This is exactly where our Option Feasibility + Risk Gate becomes necessary.
Before increasing an AMZN option position, we still evaluate premium, strike, expiry, delta, implied volatility, liquidity, bid/ask spread, time value, portfolio concentration and total capital at risk.
The stock can pass the structural test while the option itself fails the feasibility test.
That is one of the main reasons we developed CSE.
The roadmap also gives us predefined areas to monitor rather than inventing targets after price starts moving.
The current CSE roadmap includes higher continuation areas around 289, followed by approximately 297–302, with further structural expansion potential beyond that if the thesis continues to develop.
These are not promises or guaranteed price targets.
They are predefined decision zones.
And that difference matters.
Our current AMZN interpretation is therefore:
The thesis is intact.
The trend is bullish.
Tactical repair has already been reclaimed.
Silver has been reclaimed.
Bronze has been accepted.
Price is now retesting the Bronze frontier.
Existing exposure remains HOLD.
Additional exposure remains on WATCH.
Any new option decision still requires feasibility and manual approval.
That is exactly what we want CSE Capital — Option Decision OS to do.
Not tell us what we want to hear.
Not turn every bullish chart into a buy signal.
But continuously measure price against a predefined structural decision architecture and tell us what decision needs to be evaluated next.
Structure first.
Confirmation second.
Feasibility third.
No chase.
No emotion.
Only process.
 Long
Long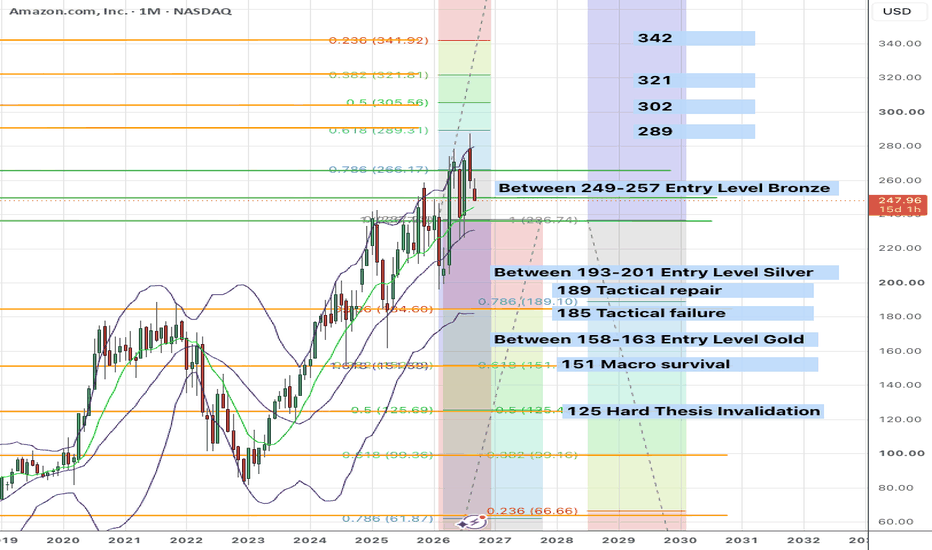
AAPL – Above Bronze Frontier, Hold/Add Watch | CSE Option DecisiDate: 2026-09-15
Type: CSE Option Decision OS Update
Apple is now another important live case inside our CSE Capital — Option Decision OS, also known as the Continuation Swing Engine.
The current AAPL dashboard gives a very clear message: the thesis is intact, the trend is bullish, and the tactical repair has been reclaimed. But CSE still does not classify this as an automatic add. The system keeps Apple in Hold / Add Watch, with the next decision filtered through feasibility and risk.
That distinction is exactly why we built the CSE Option Decision OS.
A normal chart view might simply say: “Apple is bullish” or “Apple is breaking higher.” But for options and structured portfolio exposure, that is not enough. CSE separates the thesis, the tactical repair, the entry frontiers, the option position, the add status, the risk gate and the portfolio decision.
The current CSE read for AAPL:
Manual Action: HOLD / ADD WATCH
Underlying Thesis: THESIS INTACT
Tactical Status: TACTICAL REPAIR RECLAIMED
Add Status: EVALUATE RANGE — FEASIBILITY REQUIRED
Option Position: HOLD
Signal Confidence: 82/100
Decision Price / Current Quote: 330.26
Trend: Bullish
Invalidation: 238.00
Decision Mode: Manual Only
Execution: Locked / Disabled
The Current Entry Frontier shows that Apple is now trading above the main CSE entry ranges:
Gold Current Entry Frontier: 240.44 – 248.68
Silver Current Entry Frontier: 273.02 – 283.88
Bronze Current Entry Frontier: 312.02 – 320.38
At the current quote around 330.26, AAPL is above the Bronze range. That is bullish from a structural perspective, but it also changes the risk/reward profile. Apple is no longer sitting inside the preferred entry zone. It has already moved above it.
That is why the dashboard says:
Entry Opportunity: Above Entry / Do Not Chase
Manual Overlay: HOLD / ADD WATCH
Setup: Bronze Entry Opportunity Watch
Entry Event: Hold
Order Ready: False
Auto Buy Signal: False
This is the key lesson.
AAPL can be bullish and still not be an automatic add.
The Macro Fib Thesis Lens confirms the broader structural case:
Position Archetype: Bullish Continuation
Macro Fib Status: Certified Structural Thesis — Intact
Macro Survival Support: 195.84
Tactical Repair Trigger: 249.06
Distance to Macro Support: +68.6%
Distance to Repair Trigger: +32.6%
Decision Posture: Evaluate Range — Feasibility Required
Reclaim Required: False
No Add Zone: False
Order Ready: False
That is a strong but disciplined read.
The thesis is intact.
The trend is bullish.
The tactical repair has been reclaimed.
Apple is above the Bronze Current Entry Frontier.
But CSE still requires feasibility review before any new option decision.
This is exactly the unique value of the CSE Capital — Option Decision OS. It does not just tell us whether a stock looks strong. It tells us where the stock is within the decision architecture, whether the entry zone is still attractive, whether the position should be held, whether an add can be considered, and whether the option structure is actually feasible.
For Apple, the system is not telling us to chase strength. It is telling us to respect the bullish continuation structure, manage existing exposure, and only consider new action if the full Option Feasibility + Risk Gate is passed.
That means checking premium size, liquidity, bid/ask spread, delta, expiry, time value, implied volatility, portfolio exposure, concentration risk and risk/reward before taking action.
This is the practical edge we are building.
Not prediction.
Not hype.
Not emotional trading.
A structured decision system for options and equity exposure.
AAPL remains a bullish continuation case, but the current CSE decision is disciplined: Hold / Add Watch, Evaluate Range, Feasibility Required, Do Not Chase.
Structure first.
Confirmation second.
Feasibility third.
No chase, no emotion, only process.
 Long
Long
BAC – Silver Reclaimed, Share Position Opened | CSE Option DecisDate: 2026-09-15
Type: CSE Option Decision OS Update
Bank of America is now another live case inside our CSE Capital — Option Decision OS, also known as the Continuation Swing Engine.
Last Friday, we opened a small share position in BAC. The reason was not a blind buy signal, and it was not an emotional reaction to price movement. We measured the stock against the CSE dashboard and the structure was interesting enough for controlled share exposure.
The current CSE read shows a very specific picture:
Manual Action: HOLD / ADD WATCH
Underlying Thesis: THESIS INTACT
Tactical Status: TACTICAL REPAIR RECLAIMED
Add Status: EVALUATE RANGE — FEASIBILITY REQUIRED
Option Position: HOLD
Signal Confidence: 72/100
Decision Price / Current Quote: 59.67
Trend: Bullish
Next Zone: 61.95
Invalidation: 32.24
Decision Mode: Manual Only
Execution: Locked / Disabled
This is exactly why we built the CSE Option Decision OS.
A normal chart view might simply say: “BAC is bullish” or “BAC is moving higher.” But for options and structured exposure, that is not enough. CSE separates the underlying thesis, the tactical repair, the entry frontier, the add status, the option position, the risk gate and the portfolio decision.
For BAC, the dashboard shows that the thesis is intact and the trend is bullish. The tactical repair has been reclaimed, and the Current Entry Frontier shows SILVER RECLAIMED. That is important. The Silver range around 54.84–55.95 has already been reclaimed, which means BAC has moved beyond the active reclaim zone and is now approaching the next important area.
The next CSE roadmap zone is 61.95, with the Bronze range sitting around 61.40–62.51. That creates a very clear decision area. BAC is not sitting at deep support anymore. It is moving toward a higher validation zone where the market must prove whether this is real continuation or just a temporary extension.
That is why we started with shares first.
Not options.
Not aggressive leverage.
Not automatic buying.
A controlled share position gives us exposure to the thesis while keeping the decision flexible. If BAC continues toward the 61.95 area and confirms strength around the Bronze zone, the setup can become more interesting. But if price fails near that area, the position can still be managed without the same time decay pressure that comes with options.
The Structural Authority Ladder also supports the broader case:
Tactical Failure: 47.93
Tactical Repair: 49.23
Macro Survival Support: 39.25
Hard Invalidation: 32.24
The Macro Fib Thesis Lens reads:
Position Archetype: Bullish Continuation
Macro Fib Status: Certified Structural Thesis — Intact
Decision Posture: Evaluate Range — Feasibility Required
Reclaim Required: False
No Add Zone: False
Order Ready: False
That last line matters: Order Ready False.
This is the discipline inside CSE. The system can show a bullish trend, intact thesis and reclaimed structure, while still refusing to treat the setup as an automatic order. That is exactly the difference between a decision-support engine and a simple signal tool.
For BAC, the current decision is Hold / Add Watch. We already have a small share position, so the next step is not to chase. The next step is to monitor whether BAC can move into the 61.95 / Bronze validation area and hold that structure. Only then does the next decision become relevant.
For an options strategy, BAC still needs to pass the Option Feasibility + Risk Gate. That means checking premium size, liquidity, bid/ask spread, delta, expiry, time value, implied volatility, portfolio exposure, concentration risk and risk/reward before any option idea can become actionable.
The current BAC case is therefore about process.
The dashboard showed Silver Reclaimed.
The thesis remained intact.
The trend stayed bullish.
Tactical repair was reclaimed.
The next zone is clearly defined.
But CSE still requires feasibility review.
So the decision was simple: start with controlled share exposure, manage the position, keep options under review and do not chase.
This is the edge we are building with CSE Capital — Option Decision OS.
Not prediction.
Not hype.
Not emotional trading.
A structured decision system for options and equity exposure.
Structure first.
Confirmation second.
Feasibility third.
No chase, no emotion, only process.
 Long
Long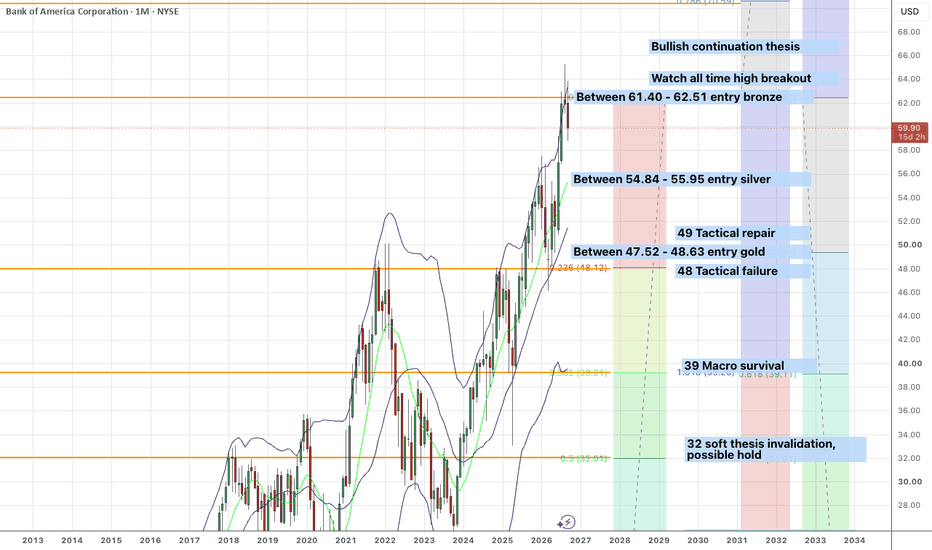
AMD – Bronze Accepted After Correction | Why CSE Chose SharesDate: 2026-09-15
Type: CSE Option Decision OS Update
AMD is currently one of the most interesting live cases inside our CSE Capital — Option Decision OS, also known as the Continuation Swing Engine.
Over the last two days, AMD gave us exactly the kind of situation where a normal trader can easily become emotional. The stock corrected sharply, volatility increased, and the question immediately became: is this weakness a warning, or is this a structured entry opportunity?
This is where our CSE decision tree becomes valuable.
Yesterday, during the correction, AMD moved into our Bronze Current Entry Frontier. The dashboard had already defined the Bronze range between 461.87 and 485.00, with the function labelled as BREAKOUT_ACCEPTED. That meant the correction was not automatically bearish. It brought AMD back into a relevant CSE decision zone.
That is why we chose to initiate a small share position first.
Not options.
Not a full aggressive add.
Not a blind buy signal.
A controlled share position.
The reason is important. AMD is structurally interesting, but CSE does not classify the current setup as fully order-ready. The system currently shows:
Manual Action: HOLD / ADD WATCH
Underlying Thesis: THESIS INTACT
Tactical Status: TACTICAL REPAIR RECLAIMED
Add Status: EVALUATE RANGE — FEASIBILITY REQUIRED
Option Position: HOLD
Signal Confidence: 75/100
Decision Price / Current Quote: 504.24
Trend: Bullish
Next Zone: 580.91
Invalidation: 291.26
Decision Mode: Manual Only
Execution: Locked / Disabled
This is exactly the distinction we want the CSE Option Decision OS to make.
The dashboard is bullish on trend and intact on thesis, but it is not saying “auto buy.” The system recognises that AMD has accepted the Bronze range, reclaimed tactical repair, and remains in a bullish continuation structure. At the same time, it keeps the decision disciplined by showing “Evaluate Range — Feasibility Required.”
That is why shares made more sense first than options.
With shares, we can participate in the thesis while keeping the position flexible. With options, the decision has to be much stricter: premium, liquidity, bid/ask spread, expiry, delta, implied volatility, concentration risk and total portfolio exposure all need to pass the CSE Option Feasibility + Risk Gate.
AMD’s Macro Fib Thesis Lens also supports the broader case:
Position Archetype: Bullish Continuation
Macro Fib Status: Certified Structural Thesis — Intact
Macro Survival Support: 359.62
Tactical Repair Trigger: 456.94
Distance to Macro Support: +40.2%
Distance to Repair Trigger: +10.4%
Decision Posture: Evaluate Range — Feasibility Required
Reclaim Required: False
No Add Zone: False
Order Ready: False
That combination is powerful, but also nuanced.
The thesis is intact.
The trend is bullish.
The tactical repair has been reclaimed.
The Bronze range has been accepted.
But the setup still requires feasibility review before any option decision.
This is exactly how we want to use CSE Capital — Option Decision OS. It is not built to generate random buy and sell signals. It is built to create a structured decision framework around Fibonacci architecture, tactical repair, entry frontiers, thesis health, option feasibility and portfolio impact.
The current AMD roadmap now points to 580.91 as the next major CSE target zone, with higher structural zones at 738.48 and 938.92. These are not guarantees or predictions. They are roadmap levels inside the model. The purpose is not to claim certainty, but to know where the next decision areas are before price gets there.
The most important part of this AMD case is the process.
Yesterday’s correction did not make us panic.
It made us measure AMD against the dashboard.
The dashboard showed Bronze Accepted.
The thesis remained intact.
The trend stayed bullish.
The tactical repair remained reclaimed.
But CSE still required feasibility review.
So the decision was: start with shares as controlled exposure, keep options under review, and do not chase.
That is the edge we are trying to build.
Not prediction.
Not hype.
Not emotional trading.
A structured decision system for options and equity exposure.
Structure first.
Confirmation second.
Feasibility third.
No chase, no emotion, only process.
 Long
Long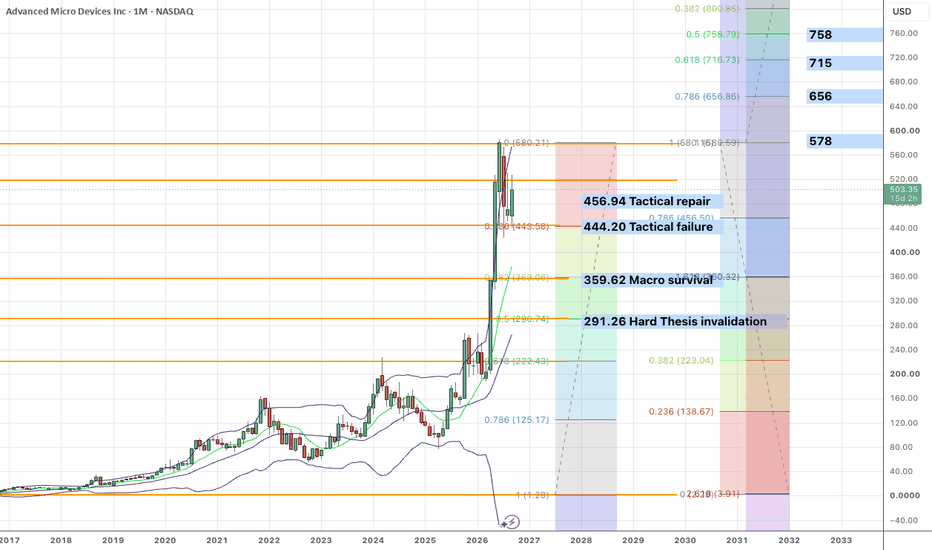
GOLD - A bounce off support before falling to 4,200 ICMARKETS:XAUUSD remains under pressure from the Fed’s hawkish stance and a strengthening dollar. In the medium term, the market may maintain its bearish trend; however, this week, all attention is focused on the Fed’s rate decision and the regulator’s comments
The dollar is forming a countertrend correction but remains locally bearish. The dollar’s rise is putting additional pressure on the metals market. Gold is maintaining its bearish market structure amid the Fed’s hawkish stance, while the market is also pricing in a high probability of a rate hike. Yields at their highest levels since 2023 are reducing the attractiveness of non-yielding gold. Trump’s rhetoric, including his calls for lower rates while acknowledging uncertainty, as well as support for Warsh’s independence, have so far failed to change the overall hawkish stance.
Technically, gold could remain within the current range ahead of the news. A false breakdown of support could trigger a correction toward the liquidity zones before the downtrend resumes.
Resistance levels: 4,345, 4,389, 4,435
Support levels: 4,287, 4,230, 4,200
The market is aiming to test the 2,292–2,287 liquidity pool. As an initial reaction to the retest, the market could trigger a rebound toward the 4,345–4,389 areas of interest and liquidity, followed by another move lower toward 4,200
Best regards,
R. Linda! Short 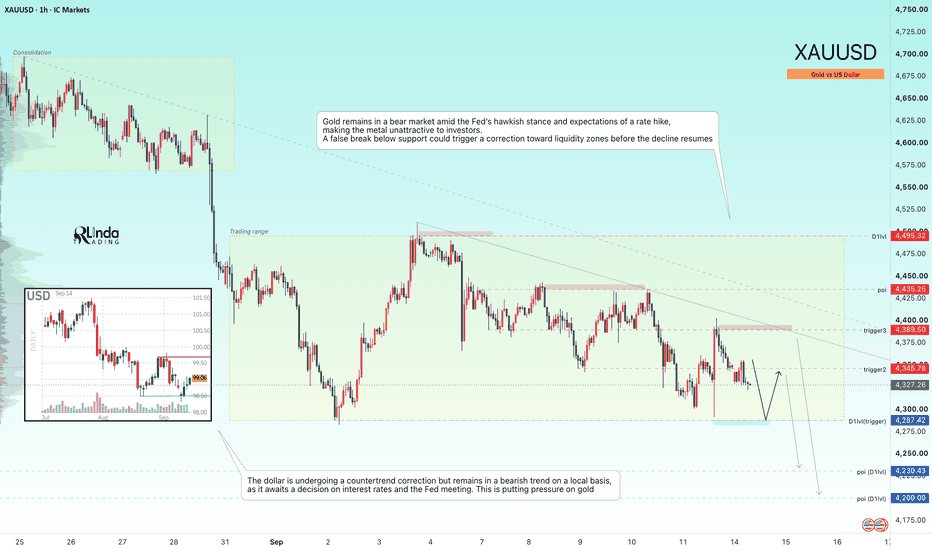
ICT STDV + ICT OTE | Advanced Precision Trading FrameworkICT STDV + ICT OTE is a structured price-action framework designed to identify high-quality trading locations by combining price expansion, liquidity, market structure and optimal retracement. The purpose is not to predict every market move, but to wait for multiple confirmations before committing capital.
ICT STDV — Understanding Price Expansion
Standard Deviation helps identify when price has expanded significantly from its reference or mean. Strong expansion can indicate an aggressive displacement phase, but an extended move should not automatically be chased.
The important question is:
Where did the expansion occur, and what liquidity or higher-timeframe level did price reach?
STDV becomes more meaningful when price expansion occurs around important liquidity, premium/discount areas, previous highs/lows, FVGs, Order Blocks or higher-timeframe dealing ranges.
ICT OTE — Optimal Trade Entry
ICT OTE focuses on entering during a controlled retracement rather than chasing displacement.
The key OTE area is generally located around the 0.62–0.79 Fibonacci retracement, with 0.705 commonly treated as an important reference.
A quality OTE setup should preferably have additional confirmation such as:
• Liquidity sweep
• Market structure shift
• CHoCH/BOS
• Strong displacement
• FVG
• Order Block
• Premium/Discount alignment
• Higher-timeframe directional bias
BUY MODEL
For a bullish setup, wait for price to take sell-side liquidity and show evidence that sellers are losing control. A bullish displacement or structure shift should then occur.
Instead of buying an extended candle, wait for price to retrace toward the OTE area. The setup becomes stronger when OTE aligns with a bullish FVG, Order Block or discount area.
The stop-loss must be placed beyond a logical invalidation point, not randomly based on how much loss the trader is comfortable with.
SELL MODEL
For a bearish setup, wait for price to take buy-side liquidity and then demonstrate bearish displacement or a market structure shift.
After the displacement, wait for the retracement into the OTE area. A bearish FVG, Order Block or premium zone can provide additional confluence.
Do not sell simply because price has reached an OTE level. OTE is a location, not confirmation.
STRICT RISK MANAGEMENT
Professional trading begins with protecting capital.
1. Risk small and consistently.
Never risk an amount that can emotionally affect your decision-making.
2. Define SL before entry.
If you cannot identify where the setup becomes invalid, you do not have a complete trade plan.
3. Never move SL farther to avoid taking a loss.
A losing setup is a business expense, not a reason to destroy your risk model.
4. Maintain realistic Risk-to-Reward.
Only take trades where the potential reward justifies the defined risk.
5. Never revenge trade.
One losing trade does not need to be recovered immediately.
6. Avoid overtrading.
A trader does not get paid for the number of trades taken. The objective is to execute only the clearest opportunities.
7. Reduce risk during poor conditions.
If volatility, structure or liquidity conditions become unclear, protecting capital is more important than forcing an entry.
STRONG DISCIPLINE RULES
WAIT → CONFIRM → EXECUTE → MANAGE → EXIT
Do not enter because price is moving quickly.
Do not chase displacement.
Do not enter because an OTE zone has been touched.
Do not trade simply because STDV shows expansion.
Wait for the complete story.
Liquidity → Displacement → Structure → Retracement → OTE → Confirmation → Entry
If one of the major conditions is missing, there is no obligation to trade.
TRADING PSYCHOLOGY
The biggest advantage of a trading system is not the setup itself — it is the ability to follow the setup without emotional interference.
Accept the possibility of losing before entering the trade. Once the risk is defined, there should be no emotional reason to interfere with the position.
Do not increase lot size after a winning streak.
Do not double risk after a loss.
Do not move targets because of greed.
Do not close good trades purely because of fear.
Do not force a trade because you have been waiting for hours.
Missed trade > Bad trade.
A missed opportunity costs nothing. A low-quality entry can damage both capital and confidence.
FINAL EXECUTION MODEL
The highest-quality ICT STDV + OTE setups come from confluence rather than a single indicator or Fibonacci level.
Higher-timeframe bias provides direction.
Liquidity provides the reason for the move.
STDV helps identify expansion.
Displacement reveals institutional aggression.
Market structure provides confirmation.
OTE provides the retracement location.
FVG/OB can refine the entry.
Risk management protects the account.
Discipline ensures the plan is actually followed.
The goal is not to trade every move.
The goal is to wait for the right move, risk a controlled amount, execute without emotion, and protect capital when the market provides no clear opportunity.
This framework is educational and should be validated through backtesting, forward testing and disciplined execution before being applied with real capital. Education 
GOLD — Pullback Before the Next Bullish Leg?📊 GOLD — Key Retracement Region to Watch
Gold formed a bullish divergence on the RSI on the 1D timeframe, which was followed by strong upward momentum, pushing price toward the 4700 level.
After being rejected from 4700, Gold has entered a deeper correction without any signs of top and has now retraced more than 50% of the previous bullish move.
Today, price also broke the previous low on the 4H timeframe, suggesting that the correction could continue further.
🔑 Important region to watch: 4240–4120
This region is particularly interesting because it contains two important Fibonacci retracement levels:
• 0.618 retracement → ~4240
• 0.786 retracement → ~4120
More importantly, this same region coincides with a Daily FVG, creating strong confluence around this area.
🟢 My bullish scenario
I’m watching the 4240–4120 region for a potential reaction.
If Gold finds support within this area and gives bullish confirmation, I believe we could see another upward leg towards 4850–4860 level, continuing the broader bullish trend.
📌 Key levels:
🔴 4700 — Previous rejection area
🔴 4850 — Next Resistance area
🟡 4240 — 0.618 retracement
🟡 4120 — 0.786 retracement
🟢 4240–4120 — Key region + Daily FVG
This is my market view, not financial advice.
Will this region become the next accumulation zone for Gold? 👀 Long 
GOLD - A countertrend correction to 4,400 ahead of the newsICMARKETS:XAUUSD remains under pressure from a strengthening dollar and a weak fundamental backdrop. The market is making new intermediate lows within the 4,290–4,500 trading range. Key news is ahead…
The dollar is bouncing from support and returning to its bullish momentum, putting further pressure on the market. Gold is trading near its weekly lows, around $4,310, on Friday following a sharp decline triggered by hotter-than-expected PPI data and rising oil prices.
According to TD Securities, a hawkish Fed may only delay the next move higher in gold rather than trigger a deeper decline, as support remains in place from dollar debasement, central bank purchases, and ETF inflows. The market is now waiting for the key U.S. CPI report.
Drivers:
Upside: soft CPI, dollar weakness, falling yields, central bank purchases, ETF inflows.
Downside: hot CPI, hawkish Fed rhetoric, dollar strength, rising yields
Resistance levels: 4,389, 4,400, 4,435
Support levels: 4,345, 4,300, 4,287
Gold is making new lows but has yet to reach the key target. A countertrend correction is forming ahead of the upcoming news. A short squeeze around the 4,390–4,400 zone could trigger another decline toward the 4,285 liquidity zone
Best regards,
R. Linda! Short 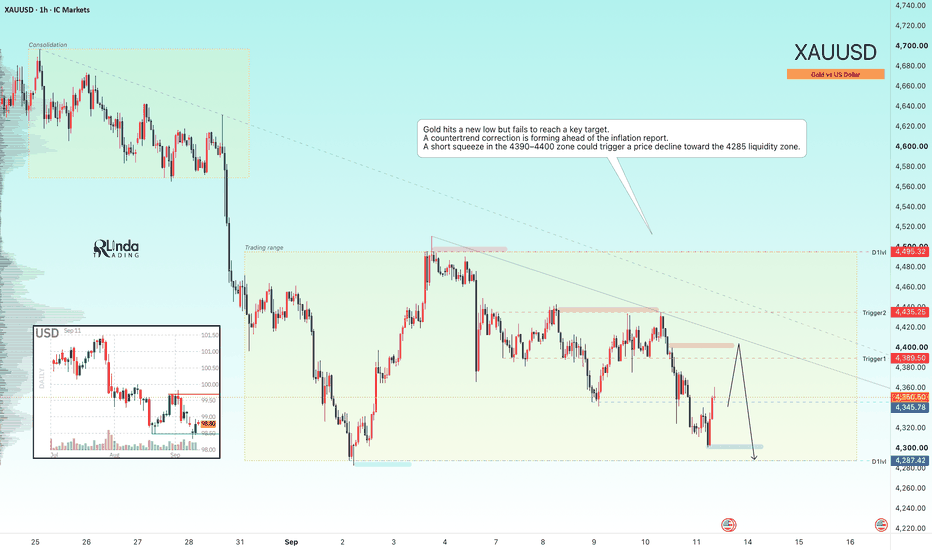
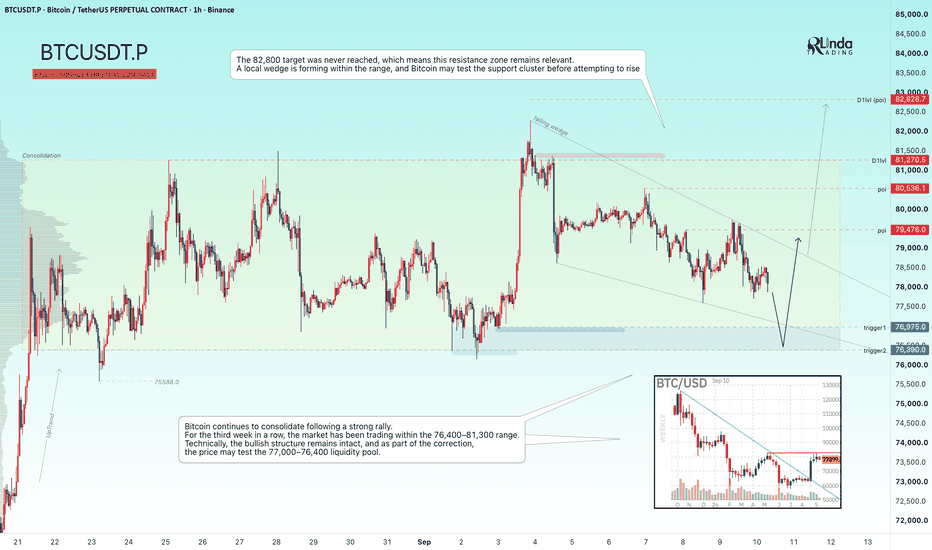
BITCOIN - A correction within a consolidation phaseBINANCE:BTCUSDT.P reached a new cycle high at 82,300, but still failed to reach the key target. The market remains in consolidation, within which a countertrend correction is developing
The fundamental backdrop remains unstable, but relatively favorable for the market. Against this backdrop, Bitcoin continues to consolidate within the current range. On September 15, the Senate is scheduled to hold another vote on the CLARITY Act.
The market has been range-bound between 76,400 and 81,300 for the third consecutive week. Technically, a local wedge is forming within the range, and Bitcoin could test the support cluster before attempting another move higher. The bullish structure remains intact, and during the correction, price could test the 77,000–76,400 liquidity pool
Resistance levels: 79,470, 80,500, 81,270
Support levels: 77,000, 76,390
The correction appears to be aimed at a potential liquidity hunt. The key focus remains on the support zones mentioned above. A long squeeze could become a technical catalyst for the continuation of the uptrend
Best regards,
R. Linda!  Long
Long