Gold | Has the Triangle Completed and Is the Next Bearish Wave B⏱️ Reading Time: ~2 minutes
In our previous analysis, we considered both bullish and bearish scenarios.
However, based on the current structure, the bullish scenario is temporarily off the table.
🔻 Bearish Scenario
If the Triangle shown on the chart has indeed completed, the current move may mark the beginning of a new bearish structure.
In this case, we would expect the decline to develop through at least a three-wave structure. The important point is that a deeper decline could retrace a significant portion of the recent advance, making that advance more consistent with a sharp correction rather than the beginning of a new bullish trend.
From a higher-degree perspective, there is another important possibility:
If the previous Daily structure was a Leading Diagonal, Elliott Wave guidelines allow for the correction that follows it to be sharp and deep.
For this reason, at this stage, we are not focused on price direction alone.
The way the next waves develop will be what confirms or challenges the bearish scenario.
🔍 Structure Before Forecast
For now, our focus is on how price reacts to the corrective channel and the confirmation levels marked on the chart.
If the bearish structure develops properly, lower targets may gradually come into play.
But if the market builds a valid bullish structure again, the current wave count will need to be reconsidered.
We are not here to guess the market’s path.
We wait for the structure to reveal it.
Patterns whisper. I listen. — Mr. Nobody 🎧📊
Gold Spot / U.S. Dollar
2 days ago
Gold: Listening to the Structure Behind the Next Move
 Short
Short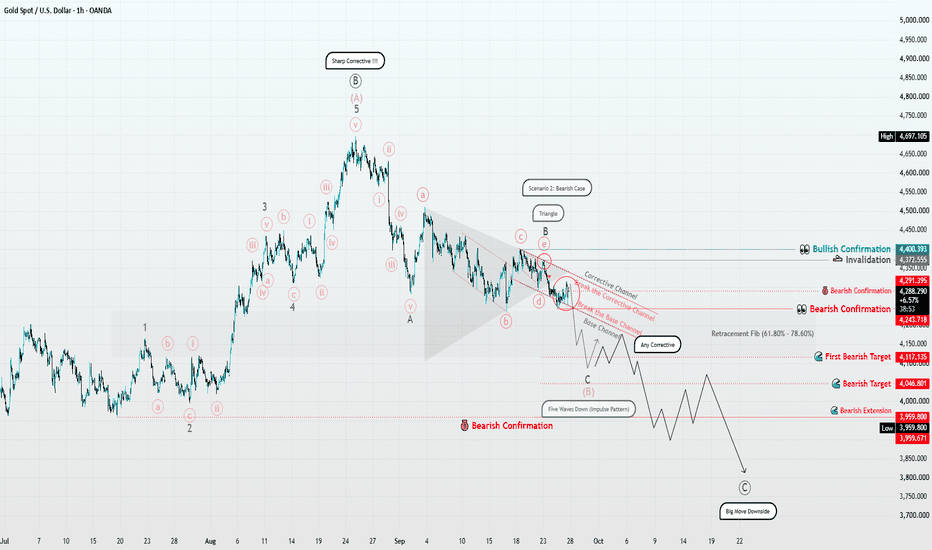
Brent Crude Oil | Is a Nested Structure Developing?⏱️ Reading time: About 2 minutes
In this latest 4H update of Brent crude oil, the main focus remains on the bullish structure. However, this scenario can only become stronger if the market continues to maintain a sequence of nested structures across multiple degrees.
At the moment, after the initial wave, we are watching the development of 1&2 structures across different degrees. The recent decline does not invalidate this scenario by itself, as it could still be part of a lower-degree correction.
It is even possible that the current decline is only the first leg of a smaller corrective structure. Therefore, what matters is not simply how deep the decline becomes, but where it fits within the overall structure and how price responds afterward.
As long as the important lows of the previous structures hold, and each Wave 2 does not move beyond the origin of its corresponding Wave 1, the nested structure remains valid for consideration.
However, if the decline continues and the lower-degree structures fail to hold, the probability of a larger-degree correction, potentially Wave II?, would increase.
For now, the bullish scenario still needs price action after each correction.
The market needs to show impulsive behavior again, maintain the sequence of nested structures, and, most importantly, demonstrate increasing strength as the upside structure develops.
If this behavior continues, each new meaningful low could provide valuable information about the development of a larger Wave III.
For me, the main question remains:
Is the market actually building a nested structure at the beginning of Wave III, or was this advance part of a larger corrective structure?
For now, the chart does not give us a definitive answer.
So we let price reveal the next structure.
Patterns whisper. I listen.
— Mr. Nobody 🎧📊
CFDs on Crude Oil (WTI)
4 days ago
Crude Oil | What Is the Current Wave Structure Telling Us?
Bitcoin 15M | Structure Must Confirm the Path⏱️ Reading Time: ~2 minutes
Hey everyone,
In this short-term Bitcoin update, I’m looking at two main paths. At the moment, however, the bearish scenario has the stronger structural position.
🟢 Bullish Scenario
For the bullish scenario to become more convincing, the market needs to prove itself through a clear motive structure.
Simply breaking above a resistance level or making a sharp move higher is not enough for me. The new advance should develop a recognizable impulsive structure, followed by a correction that is proportional to the previous growth in terms of depth, time, and wave personality.
If the correction remains within an appropriate range and the internal structure continues to support the bullish case, the path toward the higher targets could become active again.
So in this scenario, the market needs to prove itself.
🔴 Bearish Scenario
On the other hand, the bearish scenario currently provides a simpler structural explanation for the recent price action.
If the latest bullish move fails to develop into a complete motive structure and price loses the key levels marked on the chart, the possibility increases that the recent rise was part of a corrective pattern.
In that case, the current decline could be a continuation of that corrective structure, potentially developing into a larger bearish sequence as the next waves unfold.
Even here, however, the size of the decline alone is not enough for me. We need to see whether the market actually develops a bearish structure wave by wave and degree by degree.
🔎 Final Thought
For now, the bearish scenario has the stronger structural position, but the bullish scenario is not invalidated.
For that to change, the market needs to build a clear motive structure on the upside and then show that the following correction is proportional to the previous advance and consistent with its wave personality.
Ultimately, what matters to me is not simply the direction of price, but the quality of the structure the market develops next.
The structure must prove itself; we simply listen.
– Patterns whisper. I listen. – Mr. Nobody 🎧📊
🔎 A Note on the Previous Decline
One important point I want to add is that, before the previous major decline, I was already considering the bearish scenario more likely based on the structure. The subsequent price action provided further confirmation of that interpretation.
This time, however, I’m not giving the bullish scenario the same level of structural confirmation yet. The bullish path still needs to prove itself through a clear motive structure and a proportional correction.
So for now, I’m keeping the bearish scenario structurally stronger, while allowing the market to show whether the bullish alternative can earn that confirmation.
Bitcoin
2 days ago
Bitcoin 2H | An Impulse at the Crossroads
 Short
Short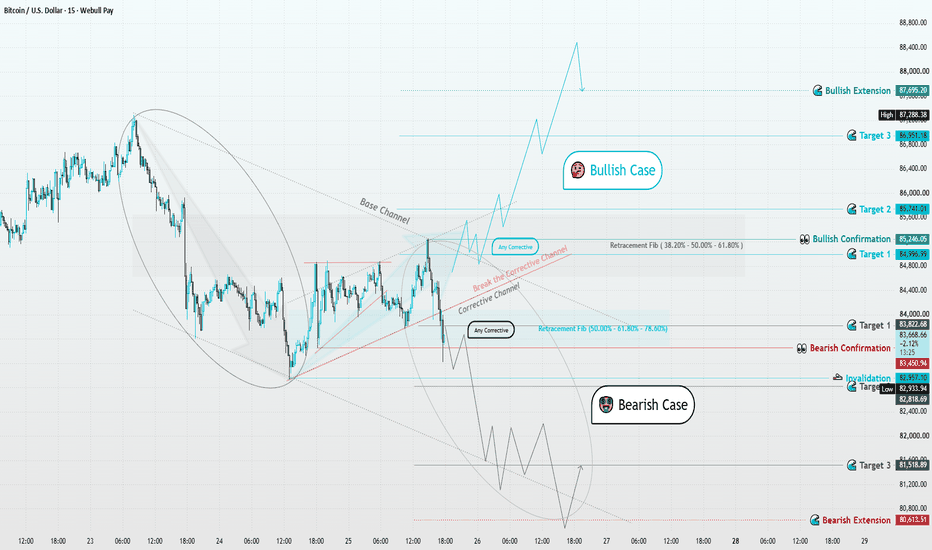
XAU/USD 25 September 2026 Intraday AnalysisH4 Analysis:
-> Swing: Bullish.
-> Internal: Bearish.
Bias and analysis to remain the same as analysis dated 30 June 2026.
Price did not print bullish CHoCH to indicate bullish pullback phase initiation. Price instead printed a new low followed by a bullish CHoCH
Price is currently trading within and established internal range, however, I will continue to monitor price with respect to depth of pullback.
Intraday expectation:
Price to trade up to either premium of internal 50% EQ, or H4 demand zone before targeting weak internal low, currently priced at 3,942.100.
Note:
Gold remains volatile as tensions between the US, Israel, and Iran keep safe‑haven demand elevated.
Markets are reacting quickly to every headline, while uncertainty around the Fed’s easing path and shifting U.S. policy under President Trump, especially tariffs continues to fuel choppy price action.
For newer traders, the key is simple, stay flexible and manage risk carefully, as fast spikes and sudden reversals are a normal part of the current XAU/USD environment.
H4 Chart:
M15 Analysis:
-> Swing: Bearish.
-> Internal: Bullish.
Analysis and bias to remain the same as yesterday's analysis dated 21 September 2026.
Price has printed according to analysis dated 17 September 2026 whereby I mentioned, in intraday analysis, due to the narrowing of the internal range, price could potentially strong internal high and print a bullish iBOS as we are also seeing a drastic reduction in the depth of the internal range.
Price has printed a bearish CHoCH to indicate bearish pullback phase initiation.
Price is now trading within an established internal range. CHoCH positioning is denoted with a blue dotted horizontal dotted line.
Intraday expectation:
Price to trade down to either discount of internal 50% EQ, or M15 supply zone before targeting weak internal high, currently priced at 4,399.670.
Note:
Gold remains highly reactive on M15 as geopolitical risk continues to drive quick, headline‑led moves.
The tension between the US, Israel, and Iran is keeping safe‑haven demand elevated, with markets still sensitive to any sign of escalation.
At the same time, shifting US tariff policy under President Trump is adding extra uncertainty, fuelling sharp intraday swings and increasing the likelihood of sudden sentiment flips. Liquidity pockets and whipsaws remain common, making disciplined risk management essential.
Gold’s geopolitical premium is still firmly in place, and until tensions ease, short‑term volatility is likely to stay front‑loaded.
M15 Chart: XAUUSD Daily Outlook — Liquidity Sweep Before Expansion | Key OBXAUUSD / GOLD — Daily Market Structure & Liquidity Outlook
Gold is currently trading around the 4,280 area and remains positioned between two important liquidity zones. The current price action is consolidating after the strong bullish expansion seen in August, while the market continues to respect higher-timeframe Order Blocks, Fair Value Gaps, and liquidity pools.
The chart highlights a potential liquidity-driven move rather than a straight directional continuation.
Key Areas on the Chart
1. Current / Lower Liquidity Area — ~4,260
Price is currently trading very close to an important liquidity zone around 4,260–4,265.
There are multiple recent lows around this area, which means sell-side liquidity may be resting underneath them.
A clean sweep below this area could become the first confirmation for the projected scenario.
2. 4H + Daily Order Block — ~4,080–4,125
This is the major higher-timeframe demand / Order Block highlighted on the chart.
If Gold breaks below the current 4,260 liquidity area, the 4,120–4,080 region becomes an important downside area to monitor.
This zone represents my main higher-timeframe bullish reaction area.
3. Upper Liquidity Area — ~4,390–4,435
There is significant liquidity resting above the recent consolidation highs.
If price reclaims the current structure and starts expanding upward, this becomes the first major upside target.
A sweep of these highs would also bring Gold directly toward the 4H imbalance / supply structure.
4. 4H Temporary Bias Zone — ~4,445–4,485
This is an important short-term reaction area.
If Gold rallies into this region after taking lower liquidity, I will closely monitor:
bearish displacement
lower-timeframe CHoCH / MSS
rejection candles
liquidity sweep
FVG formation
failure to maintain price above the zone
A strong rejection here could provide confirmation for another downside expansion.
Potential price-delivery scenario — not an exact projected path.
5. Daily FVG — ~4,480–4,560
There is still a higher-timeframe Daily Fair Value Gap above price.
The market may eventually seek this imbalance before establishing its next major directional move.
6. Untapped Daily Order Block — ~4,560–4,645
This remains the major higher-timeframe supply area.
It has not yet been fully mitigated, making it an important zone to keep on the radar if Gold continues higher.
My Primary Scenario
The current roadmap I am watching is:
4,260 liquidity → downside liquidity sweep → bullish reaction → 4,390–4,450 liquidity → bearish reaction → deeper retracement
The dashed projection on the chart is not a prediction of the exact path or timing. It represents the liquidity sequence I am monitoring.
Phase 1 — Sell-Side Liquidity
The first possibility is a break below the current 4,260 liquidity area.
If price takes these lows and immediately shows strong bullish displacement, it could indicate that sell-side liquidity has been collected.
Phase 2 — Upside Expansion
Following a successful lower-liquidity sweep, Gold could rotate toward:
4,390 → 4,430 → 4,450+
This would allow price to target the liquidity resting above the recent range.
Phase 3 — Reaction From Premium Area
The 4,440–4,480 region will then become extremely important.
A liquidity sweep followed by bearish structure confirmation from this area could open the possibility of another major move lower.
Potential downside areas would then include:
4,260 → 4,200 → 4,120
Alternative Scenario
The market does not have to follow the projected path.
If Gold shows strong Daily / 4H acceptance above approximately 4,480, the bearish reaction scenario becomes weaker.
In that case, price could continue filling the Daily imbalance and move toward the major Untapped Daily Order Block around 4,560–4,645.
Therefore, confirmation is more important than anticipating the move.
Important Confirmation Checklist
Before taking any setup around these zones, I would look for:
Liquidity sweep
Market Structure Shift / CHoCH
Strong displacement candle
Fair Value Gap formation
Order Block confirmation
Rejection from HTF zone
Lower-timeframe confirmation
Appropriate risk-to-reward
I would not enter simply because price touches one of these areas.
Overall Bias
Short-term: Watching for liquidity below the current range.
Intermediate: Potential recovery toward 4,390–4,450 after lower liquidity is collected.
Higher timeframe: Major reaction zones remain 4,480–4,645 above and 4,080–4,125 below.
The objective is to follow liquidity + market structure, rather than predicting every candle.
Educational analysis only. This chart represents a market scenario, not a guaranteed price path. Always wait for confirmation and manage risk appropriately.
⚠️ Disclaimer: This analysis is for educational purposes only and should not be considered financial or investment advice. Trading involves risk. Please do your own research and manage your risk before taking any trade. XAU/USD 24 September 2026 Intraday AnalysisH4 Analysis:
-> Swing: Bullish.
-> Internal: Bearish.
Bias and analysis to remain the same as analysis dated 30 June 2026.
Price did not print bullish CHoCH to indicate bullish pullback phase initiation. Price instead printed a new low followed by a bullish CHoCH
Price is currently trading within and established internal range, however, I will continue to monitor price with respect to depth of pullback.
Intraday expectation:
Price to trade up to either premium of internal 50% EQ, or H4 demand zone before targeting weak internal low, currently priced at 3,942.100.
Note:
Gold remains volatile as tensions between the US, Israel, and Iran keep safe‑haven demand elevated.
Markets are reacting quickly to every headline, while uncertainty around the Fed’s easing path and shifting U.S. policy under President Trump, especially tariffs continues to fuel choppy price action.
For newer traders, the key is simple, stay flexible and manage risk carefully, as fast spikes and sudden reversals are a normal part of the current XAU/USD environment.
H4 Chart:
M15 Analysis:
-> Swing: Bearish.
-> Internal: Bullish.
Analysis and bias to remain the same as yesterday's analysis dated 21 September 2026.
Price has printed according to analysis dated 17 September 2026 whereby I mentioned, in intraday analysis, due to the narrowing of the internal range, price could potentially strong internal high and print a bullish iBOS as we are also seeing a drastic reduction in the depth of the internal range.
Price has printed a bearish CHoCH to indicate bearish pullback phase initiation.
Price is now trading within an established internal range. CHoCH positioning is denoted with a blue dotted horizontal dotted line.
Intraday expectation:
Price to trade down to either discount of internal 50% EQ, or M15 supply zone before targeting weak internal high, currently priced at 4,399.670.
Note:
Gold remains highly reactive on M15 as geopolitical risk continues to drive quick, headline‑led moves.
The tension between the US, Israel, and Iran is keeping safe‑haven demand elevated, with markets still sensitive to any sign of escalation.
At the same time, shifting US tariff policy under President Trump is adding extra uncertainty, fuelling sharp intraday swings and increasing the likelihood of sudden sentiment flips. Liquidity pockets and whipsaws remain common, making disciplined risk management essential.
Gold’s geopolitical premium is still firmly in place, and until tensions ease, short‑term volatility is likely to stay front‑loaded.
M15 Chart: Silver | Has the Structure Chosen Its Path?⏱️ Reading Time: ~2 minutes
In our previous analysis, we had two possibilities on the table: Wave IV had completed and a new bullish move was beginning, or the larger correction was still unfolding.
Now, the price structure has moved one step further and given us clearer levels to monitor for both scenarios.
🟦 Scenario 1 — Bullish Path
If the recent decline was a Wave 2, the current move could be the beginning of a new impulse.
In this case, a break and sustained move above the bullish confirmation levels would strengthen this scenario, opening the path first toward 67.73 and then 71.18.
If the structure continues to develop, the higher targets at 74.45 and 76.49 remain on the table.
But for us, price going up is not enough.
The internal five-wave structure must reveal itself.
⬛ Scenario 2 — Bearish Path
On the other hand, if the larger correction is not yet complete, the current move could still be part of a broader corrective structure.
A break and confirmation below the key levels would strengthen this scenario and could open the path toward 63.53, 62.30, and 60.55, with further extension possible if the structure continues.
So, we are still not here to tell the market what it must do.
We simply follow the structure,
watch the confirmation levels,
and let the market choose the scenario.
Patterns whisper. We listen.
Mr. Nobody | Elliott Wave Principle Research
Silver / U.S. Dollar
2 days ago
Silver | One Structure, Two Possible Paths
Bitcoin 2H | An Impulse at the Crossroads⏱️ Reading Time: ~3 minutes
Hey everyone,
In this 2H Bitcoin update, I’m focusing on one main question:
Is the recent bullish structure still developing as an impulsive pattern, or has that impulse already been completed and the market entered a higher-degree correction?
🟦 Scenario 1 | Bullish Case
In the bullish scenario, as long as price does not enter the territory of Wave 1, the current structure can still be considered a potential Impulse.
One interesting feature of this count is the relationship between the internal waves within the larger Wave (V). The approximate equality between the initial wave and Wave 3 is particularly interesting from a structural perspective.
If these five waves complete, the next important question is not simply whether price moves up or down, but what type of corrective structure develops afterward and at what degree.
If this entire move is actually part of a larger Wave (III), then after the correction is complete, Bitcoin could potentially continue higher and even return toward its previous all-time high, allowing the larger structure to develop into a more complete impulsive move.
⬛ Scenario 2 | Bearish Case
In the bearish scenario, the assumption is that the recent impulse has already been completed, and the current decline could be the beginning of a correction to that impulsive structure.
At this stage, the exact form of the correction is still unknown. It could develop as a Zigzag, Double Zigzag, Flat, or a more complex corrective structure.
After three corrective waves are completed at a higher degree, another downward move could potentially follow.
There is also a possibility that the current sharp decline is only the beginning of a sharp corrective pattern, followed by stronger downside pressure.
However, even in that case, I would not judge the larger trend simply by the strength of the decline. The bearish structure would need to develop wave by wave and degree by degree before we could connect it to a larger-degree structure.
🔎 The Key Question
For now, both paths remain structurally open:
Completion of an Impulse and continuation higher,
or
Completion of the Impulse followed by a higher-degree Correction.
For me, the most important thing at this stage is not simply whether the market moves up or down, but what structure the next move creates and at what degree it develops.
The market will reveal the answer through structure.
We follow the structure, not the prediction.
– Patterns whisper. I listen. – Mr. Nobody 🎧📊
Bitcoin
Jul 4
Bitcoin 4H | Is the First Bearish Leg Complete.
Long 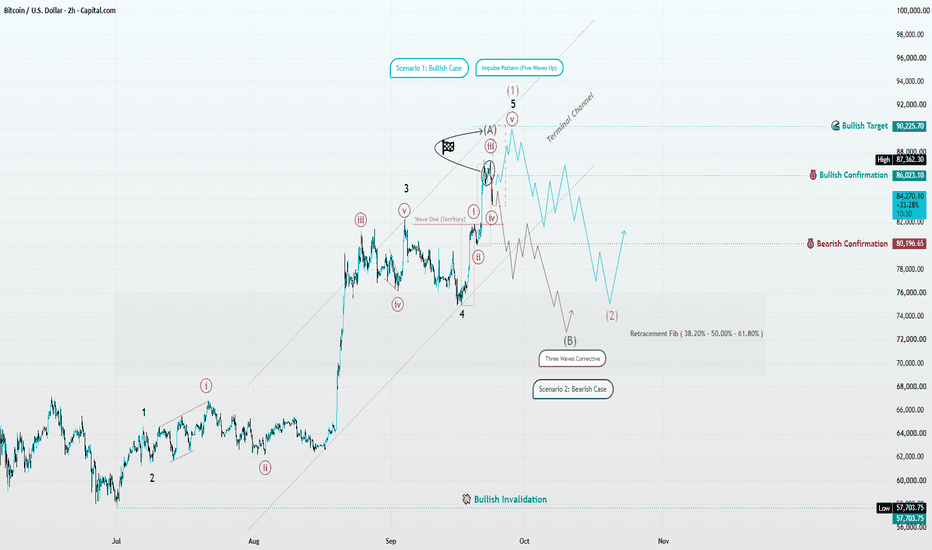
🇺🇸 DXY | Short-Term Strength or the Start of a Larger Move? ⏱️ Reading time: about 3 minutes
In this update, we are taking another look at the DXY structure, this time with greater focus on the behavior we are seeing from the U.S. dollar in the short term.
At the moment, significant short-term strength is visible, and price is approaching several important levels marked on the chart.
But from an Elliott Wave perspective, simply seeing price move higher is not enough for us.
The key question is:
Is this advance the beginning of a new bullish structure, or is it simply part of a correction before a deeper decline?
🟦 Scenario 1 — Bullish Case
If DXY can break through the confirmation levels and then develop a valid motive structure, the recent strength would become much more significant.
In that case, the bullish scenario could develop beyond a simple corrective move and potentially create the conditions for a larger bullish structure.
But to reach that conclusion, the market needs to build the required structure itself.
Under such conditions, dollar strength may not remain limited to DXY and could potentially be reflected in the behavior of other markets as well.
From my personal perspective, one area worth watching is the behavior of oil and capital flows in the Gulf region, along with the reaction of other dollar-sensitive assets.
This does not mean there is a fixed or certain relationship. Rather, these relationships can serve as clues when examining how different markets are behaving together.
⬛ Scenario 2 — Bearish Case
On the other hand, an important possibility remains that the current rise in DXY is simply part of a corrective structure.
If price fails to develop a strong bullish structure and turns lower again, the deeper bearish scenario could regain importance.
In that case, structures such as a Simple Zigzag or Double Zigzag could still be considered as part of the larger correction.
So even if the dollar rises in the short term, we cannot conclude from price direction alone that the larger trend has changed.
The quality of the structure matters more than the direction of the move itself.
🔄 DXY Footprints Across Other Markets
In my own observations, I have seen the relationship between DXY and gold, oil, and the cryptocurrency market change across different periods.
But this correlation is not always the same.
Sometimes dollar strength can occur alongside strength in another asset, sometimes an inverse relationship develops, and at other times two markets may move in the same direction for a while before their relationship reverses.
That is why I do not treat these relationships as fixed market laws.
For me, the structure of each individual market against the U.S. dollar remains the key factor.
If DXY develops a bearish structure, then—provided the corresponding structures confirm it—the possibility of strength in gold, oil, or cryptocurrencies may become more relevant.
But even then, an asset may initially move alongside the dollar and later reverse its path. Everything depends on the internal structure of that particular market.
🌍 A Personal View of the Future
From my personal perspective, global markets are more than just a collection of charts. Behind these movements are economic decisions, capital flows, energy resources, technology, and the choices made by the global community.
In the future, changes in energy, technology, and especially artificial intelligence may influence the way capital flows and assets are valued.
But this part is my personal view of the future and should not be interpreted as a certain prediction.
When analyzing the market, we still follow the same simple principle:
We see the structure first; then we build the scenario.
For now, DXY's short-term strength is significant, but we need to see whether this strength develops into a valid bullish structure, or whether it ultimately proves to be only part of a correction before a deeper decline.
The market will give us the answer through its structure.
Structure First. Scenario Second.
Patterns whisper. I listen.
— Mr. Nobody
U.S. Dollar Currency Index
Jul 6, 2023
Big Correction DXY
US Dollar Index
7 days ago
DXY 2H | The Next Structure Will Define the Larger Path
Gold: Listening to the Structure Behind the Next Move⏱️ Reading Time: ~2 minutes
Bullish and Bearish Scenarios | Elliott Wave Principle
At the current stage, two primary structures remain under consideration. The key point is that price structure must determine which scenario gains greater validity, rather than direction alone.
🟦 Bullish Case
The market may be completing a corrective structure in the form of a Classic Zigzag, with the recent advance representing part of Wave C.
An important observation is that Wave C has so far retraced only approximately 61.8% of the powerful initial decline. Therefore, this advance alone is not sufficient to confirm a sustained bullish move.
If the current bullish structure holds and gradually develops into a valid motive pattern, we may be witnessing the early stages of a larger upward movement. It is also possible that the market is completing Wave II before an extended bullish move.
Within this scenario, the internal structure of the wedge may become complex, potentially involving a Triangle or several nested patterns. For this reason, the wedge’s appearance alone is not enough to reach a conclusion. What matters is how the waves develop across the smaller degrees.
🟥 Bearish Case
On the other hand, the Triangle visible on the chart may already be complete. If so, the market could be preparing for another decline, potentially with greater momentum.
From a higher-degree perspective, if the recent decline is interpreted as a Leading Diagonal, the subsequent advance may simply be a sharp correction.
This is precisely why, within the bullish scenario, we are also examining the current advance as a possible Impulse. Leading Diagonals are often followed by sharp corrective movements, and the market’s next structure will help us distinguish between these possibilities.
If the daily structure is part of a larger Zigzag, the current advance may represent only a portion of the correction. Once that correction is complete, another bearish wave could begin.
🔍 Structure Over Forecast
Gold’s behavior should also be observed alongside the U.S. Dollar, Crude Oil, and even the cryptocurrency markets. Correlations between these markets may provide additional clues, but structure remains more important than correlation or prediction.
Sometimes, a wedge can develop in either direction. Ultimately, the path will be determined by the strength of the price movement, the internal wave structure, and the way buying and selling orders are absorbed or accumulated.
For now, patience remains essential. We will wait for the market to reveal its next structure.
Patterns whisper. I listen. – Mr. Nobody 🎧📊
Gold Spot / U.S. Dollar
2 days ago
Gold | Structure Before Direction
Crude Oil: Nested Structure?⏱️ Reading Time: ~3 minutes
From an Elliott Wave perspective, crude oil appears to have entered a large corrective structure following Wave (I). At this stage, the broader correction is being considered as Wave (II).
However, recent price action raises an important possibility: the market may be developing a nested structure across multiple degrees within this correction.
Bullish Scenario
Under the first scenario, the current structure may consist of a series of nested 1-2 structures across different degrees.
If this interpretation is correct, the market could complete the smaller corrective phases and then enter a higher-degree Wave Three. In that situation, what initially appears to be a relatively slow recovery could suddenly accelerate into a much stronger upside move.
This nested structure could explain the possibility that, after the recent decline, crude oil may recover with a speed and strength comparable to the decline itself and eventually develop into a broader bullish advance.
In this scenario, a break above the key bullish confirmation levels, together with continued Impulsive structure, would provide further evidence for this path.
Bearish Scenario
The second scenario remains valid.
If the current decline continues and the expected bullish structure fails to develop, this decline could first lead to the completion of the current Wave II.
If the decline extends further, another possibility is that the correction could expand into a higher degree, completing Wave (II) of the larger structure.
In that case, the current decline would no longer represent simply a short-term correction within the bullish scenario. Instead, it could become part of a much larger corrective structure, making the key invalidation and confirmation levels increasingly important.
Conclusion
At this stage, the key issue for me is not simply the speed of the move, but the structure behind that speed.
If the market is developing a nested 1-2 structure, its completion could create the foundation for a powerful and rapid bullish advance.
However, if selling pressure continues, the same decline could first complete the current Wave II and, if extended further, potentially complete a correction of one degree higher.
Therefore, both paths remain structurally relevant at this stage.
The structure that the market develops from here will determine whether this decline is preparing the next bullish acceleration or becoming part of a deeper correction.
Price comes first; the wave count comes second.
Patterns whisper. I listen.
— Mr. Nobody 🎧📊
Brent Crude Oil
5 days ago
Brent Crude Oil | Is Wave III Expanding?
$BTC $92K Soon? The Weekly Downtrend Is Technically BrokenCRYPTOCAP:BTC : $92,000 soon?
I'm writing an update on my long-term thoughts about Bitcoin. In my previous post I clearly said:
"BTC makes a move up and closes above 82859. That would mean a CHoCH on the 1w timeframe. A close specifically, not a sweep, and preferably higher, somewhere near 85-87k.
And one more thing as a sub point. The 87-90k zone has a fairly big volume that could potentially slow the move up a little."
Along with that, I also mentioned VWAP, specifically price holding above it. ⤴️
Both factors came together successfully. BTC tested the value area low (VAL) of the previous range (around 87k), which ran from mid-November to the end of January. Price hasn't fully entered the value area of that period yet, but the VAL test is done.
Now there's a probability of the same kind of range forming for a couple of months. After that, there's a chance of seeing a move out to the downside: an impulsive, fast move out of the range into the zone around VWAP that gets a reaction or can't find continuation and comes back into the range. In that scenario, the probability of a subsequent move out to the upside (continuation) is higher. The main thing is for the move to VWAP to be impulsive with a failed continuation. In that case, I'm in.
Maybe there will still be a black swan somewhere down the line, but here and now, the previous downtrend is technically broken. Long 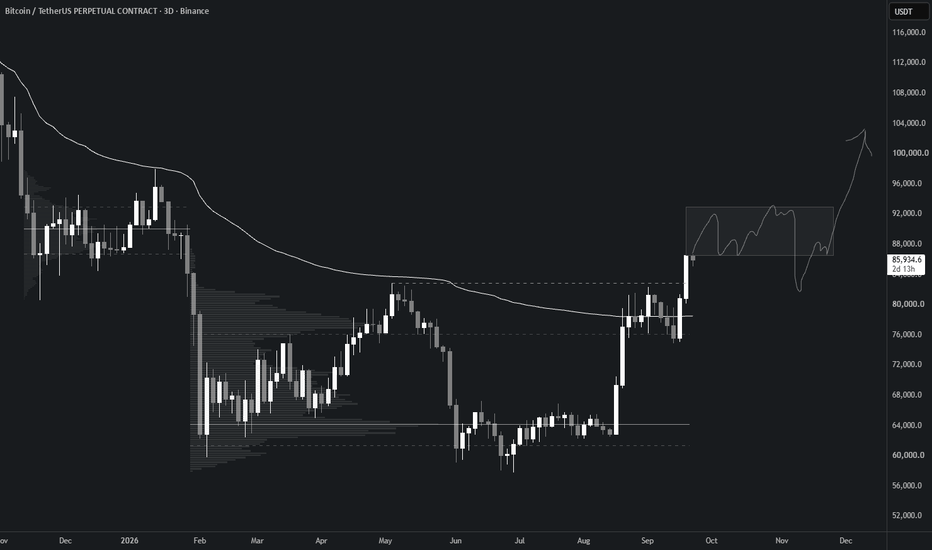
Long 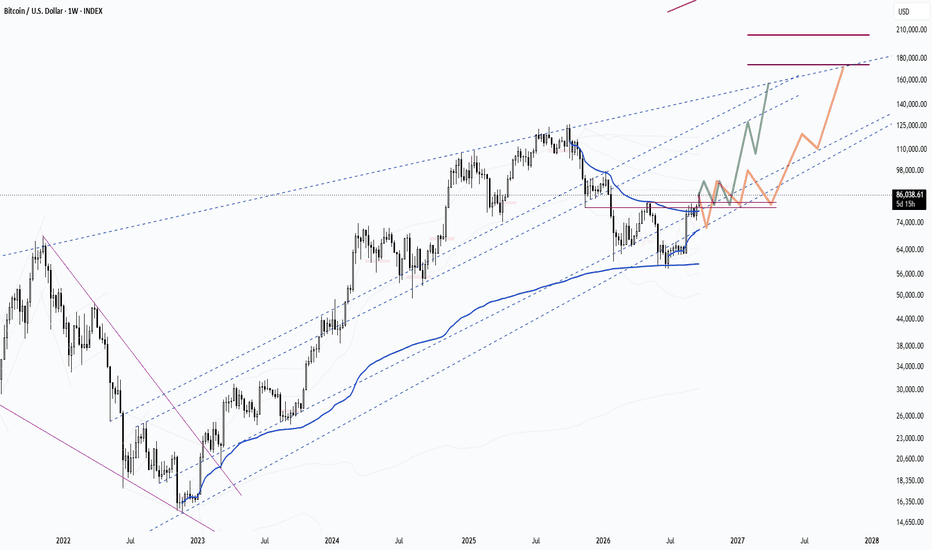
Long 
XAU/USD 22 September 2026 Intraday AnalysisH4 Analysis:
-> Swing: Bullish.
-> Internal: Bearish.
Bias and analysis to remain the same as analysis dated 30 June 2026.
Price did not print bullish CHoCH to indicate bullish pullback phase initiation. Price instead printed a new low followed by a bullish CHoCH
Price is currently trading within and established internal range, however, I will continue to monitor price with respect to depth of pullback.
Intraday expectation:
Price to trade up to either premium of internal 50% EQ, or H4 demand zone before targeting weak internal low, currently priced at 3,942.100.
Note:
Gold remains volatile as tensions between the US, Israel, and Iran keep safe‑haven demand elevated.
Markets are reacting quickly to every headline, while uncertainty around the Fed’s easing path and shifting U.S. policy under President Trump, especially tariffs continues to fuel choppy price action.
For newer traders, the key is simple, stay flexible and manage risk carefully, as fast spikes and sudden reversals are a normal part of the current XAU/USD environment.
H4 Chart:
M15 Analysis:
-> Swing: Bearish.
-> Internal: Bullish.
Analysis and bias to remain the same as yesterday's analysis dated 21 September 2026.
Price has printed according to analysis dated 17 September 2026 whereby I mentioned, in intraday analysis, due to the narrowing of the internal range, price could potentially strong internal high and print a bullish iBOS as we are also seeing a drastic reduction in the depth of the internal range.
Price has printed a bearish CHoCH to indicate bearish pullback phase initiation.
Price is now trading within an established internal range. CHoCH positioning is denoted with a blue dotted horizontal dotted line.
Intraday expectation:
Price to trade down to either discount of internal 50% EQ, or M15 supply zone before targeting weak internal high, currently priced at 4,399.670.
Note:
Gold remains highly reactive on M15 as geopolitical risk continues to drive quick, headline‑led moves.
The tension between the US, Israel, and Iran is keeping safe‑haven demand elevated, with markets still sensitive to any sign of escalation.
At the same time, shifting US tariff policy under President Trump is adding extra uncertainty, fuelling sharp intraday swings and increasing the likelihood of sudden sentiment flips. Liquidity pockets and whipsaws remain common, making disciplined risk management essential.
Gold’s geopolitical premium is still firmly in place, and until tensions ease, short‑term volatility is likely to stay front‑loaded.
M15 Chart: Episode 08 — The Architecture Behind the Waves🎬 Mr. Nobody’s Chronicle
Season I — The History of Elliott Wave Principle
Episode 08 — The Architecture Behind the Waves
⏱️ Reading time: ~3 minutes
“When we discover the language of a pattern, the next question is: How is it built?”
In the previous episode, we reached one of the most recognizable ideas behind the Wave Principle:
Five waves in the direction of the main movement...
and three waves in the corrective direction.
But one important question remained.
Do all waves have the same character?
Does every five-wave movement develop in exactly the same way?
Or is there a deeper architecture behind this seemingly simple count?
Elliott gradually realized that waves could not be identified simply by their direction or their length.
Every wave has its own behavior and structure.
In his framework, market movements could be divided into two broad families:
Motive Waves
and
Corrective Waves.
Motive waves move in the direction of the larger trend.
Corrective waves move against it.
But here, an important point must be understood.
The fact that a motive wave appears stronger or longer is not, by itself, enough to identify it.
For example, Wave 3 is not always the longest wave.
What matters in the Wave Principle is the complete set of structural rules and relationships.
In an impulse, Wave 3 cannot be the shortest of Waves 1, 3, and 5.
But the lengths of the waves can still vary.
Sometimes Wave 1 extends.
Sometimes Wave 3.
And sometimes even Wave 5.
This is what Elliott described as an Extension.
When an extension occurs, what initially appears to be a simple five-wave movement can contain a much more complex structure within it.
A wave may appear as only one wave at a higher degree...
but when we look closer, we may discover that it is composed of a series of smaller movements.
Five movements...
containing even more structure within them.
And here, we return once again to the idea we explored in Episode 05:
A pattern within the pattern.
So, to understand a wave, we should not look only at the number of movements.
We should ask:
How is this movement built?
What is its degree?
What does its internal structure look like?
And does that structure remain consistent with the rules that apply to it?
This is where an important difference appears between the appearance of a wave and its actual structure.
Two movements may look similar at first glance...
but when we examine their internal structure, we may discover that their character is completely different.
And perhaps this is where one of the most important lessons of the Wave Principle begins to reveal itself:
The wave count tells only part of the story.
The structure tells the rest.
The deeper we go into the world of waves, the more important this becomes.
Because to understand what a structure truly is, we need to know what is allowed...
and what is not allowed.
And this is exactly where the Wave Principle begins to move beyond simple market observation...
and becomes a structural framework.
A framework in which rules protect the pattern.
But alongside the rules, there are also guidelines that help us recognize and interpret possible structures.
So now that we have a broader view of the architecture of waves...
it is time to enter a more sensitive part of the story.
The rules that prevent us from calling every structure an Elliott Wave pattern.
Because in the next episode...
we are going to ask:
What makes a pattern valid?
And what can invalidate it?
To be continued...
Narrated by Mr. Nobody 🎧📊
Research & Market Studies
Mehdi & Rana
 Education
🇪🇺🇺🇸 EUR/USD 3H | When Structure Gets Complex🇪🇺🇺🇸 EUR/USD 3H | When Structure Gets Complex, the Path Is Not Always Straight 🌀
⏱️ Reading time: about 3 minutes
Following our weekly EUR/USD analysis, we are now moving closer to the 3-hour chart to examine what the current structure may be building at the lower degree.
At this stage, the bearish scenario carries more weight, and a continuation of the downward move remains one of the important structural possibilities.
Within this scenario, the current structure may be developing as a Leading Diagonal, particularly considering the internal wave subdivisions and the channels marked on the chart. If this interpretation is correct, once the bearish structure is completed, the market could enter a corrective phase before another downward wave develops.
But there is an important point here.
The market does not always move in a straight line toward the expected scenario.
If the current structure proves to be more complex than what we can see at this stage, the market may move higher once again before continuing lower.
That upward move could become part of a more complex corrective structure—for example, a sideways structure, a Double Zigzag, or even a Triple Zigzag. Therefore, another move higher, by itself, would not invalidate the bearish scenario.
For us, what matters is the internal structure of the move.
If the next upward move remains corrective and fails to develop a valid motive structure at the higher degree, it could ultimately lead to another continuation of the bearish scenario.
On the other hand, if the market develops a valid and coherent bullish structure and moves through the confirmation levels marked on the chart, then we would need to reassess the wave count.
🌍 The Bigger Picture
Alongside the technical structure, I always pay attention to the behavior of other markets as well.
At the moment, U.S. dollar strength is one factor that may be relevant to EUR/USD. The relationship between the dollar and markets such as cryptocurrencies, oil, and gas can also change over time; sometimes we see positive correlation and sometimes negative correlation. Therefore, I view these relationships mainly as clues for understanding market behavior, rather than as fixed or permanent relationships.
From my personal perspective, large market structures are not only about price. They can also reflect decisions, policies, choices, and even collective mistakes within the global economy.
The future may continue to present challenges in terms of living costs and resources, but at the same time, technological progress—especially artificial intelligence—could increase productivity and potentially improve living conditions in some areas.
I also believe, personally, that the cryptocurrency market could become one of the potential paths toward wealth creation for some people in the future. But this is simply my personal view—not a guarantee or a certain prediction.
Ultimately, as we always say:
We do not decide the future; we observe and interpret the structure the market is building in the present.
For now, the bearish continuation remains the more likely structural path in this analysis, while another upward move as part of a complex corrective structure remains entirely possible.
So, we let the market make the decision.
Structure First. Scenario Second.
Patterns whisper. I listen.
— Mr. Nobody
Euro / U.S. Dollar
4 days ago
EUR/USD — Larger Correction or the Continuation of the Bullish T
 Long
Long
Silver | One Structure, Two Possible Paths⏱️ Reading time: about 3 minutes
Following our previous Silver analyses, this time we are looking at the chart from the perspective of the previous high, allowing the relationship between the larger historical structure and the current movement to become clearer.
In this view, we have been tracking a larger corrective structure from the previous high, with the possibility of a Wave IV developing. In the lower part of the chart, a Leading Diagonal followed by a Simple Zigzag has also been identified as a structure worth monitoring.
The key point is that both current scenarios begin from the same interpretation of the previous structure. The main difference is what the market may build from here.
🟦 Scenario 1 | Bullish Case
In the bullish scenario, the structure developing from the recent low could be the beginning of a new motive wave.
The current advance could be developing as a 1–2 structure followed by Wave 3, or, at a higher degree, it could be part of a larger motive structure.
If price continues to advance with strength and then produces clean corrections proportional to the degree of each wave, the bullish structure will gradually begin to prove itself.
For us, simply reaching a higher price is not enough. What matters is whether each advance is followed by corrective behavior that matches the wave's degree and character.
If this behavior continues, the possibility of a developing Wave 3 — or a larger motive structure — becomes increasingly relevant.
⬛ Scenario 2 | Bearish Case
In the bearish scenario, the same current advance could still be part of a larger corrective structure.
In this case, the current rise may develop as a three-wave structure — for example, part of a B wave or a connecting structure within a more complex correction.
If this advance completes as a corrective three-wave structure rather than developing into a valid motive pattern, and the market then turns lower again, we could see a C wave decline that eventually completes the larger Wave IV — the structure shown on the chart as a Classic Zigzag.
🔎 What This Chart Is Telling Us
So, the difference between these two scenarios is not really about direction; it is about the character of the future structure.
In the bullish case, we expect the advances to develop into a valid motive structure.
In the bearish case, the same advance could simply be part of a larger correction, leaving another downward wave to complete the structure.
That is why there is no need to rush into changing the count.
The market has to show us the next structure.
We have studied the structure that came before; now it is up to price to show us what is actually developing from this point.
Patterns whisper. I listen.
— Mr. Nobody 🎧📊
Silver / U.S. Dollar
Sep 6
Silver 4H | The Structure Is Speaking — Elliott Wave Update
 Long
Long
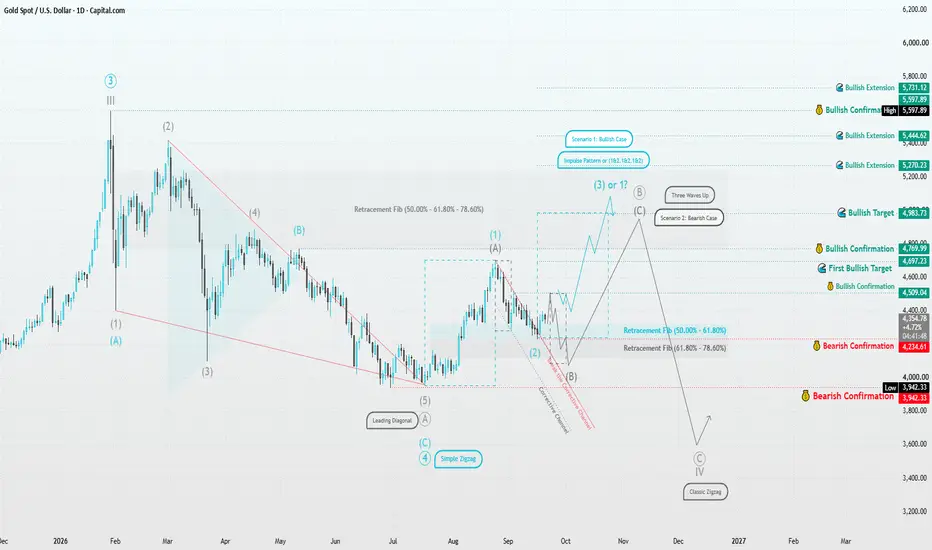
Gold | Structure Before Direction⏱️ Reading Time: ~2 minutes
In the daily timeframe, Gold’s current structure can be viewed from two perspectives. The recent move from around 3,942 may represent the beginning of a new bullish motive structure, while the current decline could potentially be Wave (2) if the 4,234–4,509 area continues to hold.
🔵 Bullish Scenario
What matters is not simply whether price rises, but whether the market develops a valid five-wave motive structure from this area. A move above 4,697, followed by 4,769, would provide stronger structural evidence for continuation toward 4,983 and potentially higher levels.
⚫ Bearish Scenario
If the next advance remains corrective and unfolds in three waves, the current rise may be only part of a larger correction. In that case, the 4,769–4,983 zone could become an area where the corrective advance ends, opening the possibility of another decline toward 4,234, 3,942, and even 3,600.
For me, the key question is not simply whether Gold is bullish or bearish.
The real question is: will the next structure be motive or corrective?
The Wave Principle allows the market itself to reveal which scenario is developing.
– Patterns whisper. I listen.
Mr. Nobody 🎧📊
Gold Spot
Sep 5
Gold’s Structural Crossroad
Long 
Long 
XAU/USD 21 September 2026 Intraday AnalysisH4 Analysis:
-> Swing: Bullish.
-> Internal: Bearish.
Bias and analysis to remain the same as analysis dated 30 June 2026.
Price did not print bullish CHoCH to indicate bullish pullback phase initiation. Price instead printed a new low followed by a bullish CHoCH
Price is currently trading within and established internal range, however, I will continue to monitor price with respect to depth of pullback.
Intraday expectation:
Price to trade up to either premium of internal 50% EQ, or H4 demand zone before targeting weak internal low, currently priced at 3,942.100.
Note:
Gold remains volatile as tensions between the US, Israel, and Iran keep safe‑haven demand elevated.
Markets are reacting quickly to every headline, while uncertainty around the Fed’s easing path and shifting U.S. policy under President Trump, especially tariffs continues to fuel choppy price action.
For newer traders, the key is simple, stay flexible and manage risk carefully, as fast spikes and sudden reversals are a normal part of the current XAU/USD environment.
H4 Chart:
M15 Analysis:
-> Swing: Bearish.
-> Internal: Bullish.
Price has printed according to analysis dated 17 September 2026 whereby I mentioned, in intraday analysis, due to the narrowing of the internal range, price could potentially strong internal high and print a bullish iBOS as we are also seeing a drastic reduction in the depth of the internal range.
Price has printed a bearish CHoCH to indicate bearish pullback phase initiation.
Price is now trading within an established internal range. CHoCH positioning is denoted with a blue dotted horizontal dotted line.
Intraday expectation:
Price to trade down to either discount of internal 50% EQ, or M15 supply zone before targeting weak internal high, currently priced at 4,399.670.
Note:
Gold remains highly reactive on M15 as geopolitical risk continues to drive quick, headline‑led moves.
The tension between the US, Israel, and Iran is keeping safe‑haven demand elevated, with markets still sensitive to any sign of escalation.
At the same time, shifting US tariff policy under President Trump is adding extra uncertainty, fuelling sharp intraday swings and increasing the likelihood of sudden sentiment flips. Liquidity pockets and whipsaws remain common, making disciplined risk management essential.
Gold’s geopolitical premium is still firmly in place, and until tensions ease, short‑term volatility is likely to stay front‑loaded.
M15 Chart: Crude Oil | What Is the Current Wave Structure Telling Us?⏱️ Reading time: about 2 minutes
In our previous oil analysis, the main question was:
What structure is the market building?
Now, after a few more days of price action, the internal structure is giving us more information.
In the previous analysis, we looked at the advance as a possible part of a higher-degree Wave III, with 105.80 as an important confirmation level.
In this update, the internal structure is becoming more detailed.
The recent move can now be viewed as a sequence of Wave 1 and Wave 2, followed by the development of Wave 3. The latest correction is also showing the characteristics of a three-wave corrective structure.
In the bullish scenario, holding this structure could keep the path open for further development of Wave 3.
For now, 102.996 is the current confirmation level, while 104.753 is the first important structural target.
If the bullish structure continues, 127.970, 142.314, 151.066, and 165.653 can be monitored as the next reference areas.
But there is another important point.
If the market moves into a deeper decline, a three-cycle structure could become relevant again. However, for that scenario to develop into a larger-degree bearish structure, the market would need to decline much further.
In that case, 79.347 and then 72.423 become important levels to watch, while 54.877 remains a major boundary for the larger bullish structure.
So compared with the previous analysis, the main question has not changed:
“Where is the market going?” is still not the question we are trying to answer.
The real question is:
“What is the current structure developing into?”
A few days of price action do not necessarily change the larger scenario.
Sometimes, they simply help us see what is happening inside the structure more clearly.
We don't follow predictions.
We follow structure.
Patterns whisper, and I listen.
— Mr. Nobody 🎧📊
Brent Crude Oil
4 days ago
Brent Crude Oil | Is Wave III Expanding?
WTI Crude OIL vs US Dollar
3 days ago
Crude Oil | Is Wave 3 Expanding?