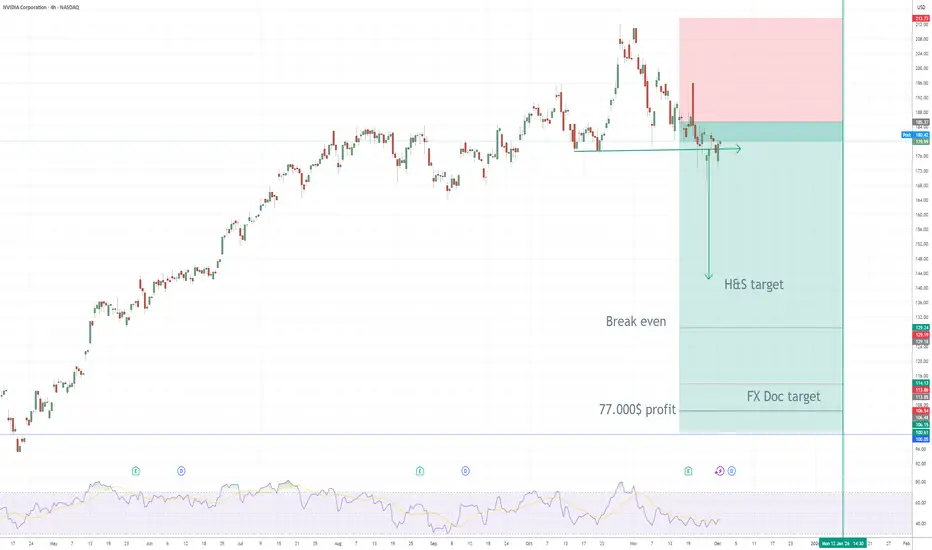
NVIDIA (NVDA) – My PUT Options Position ExplainedI opened a medium-term bearish position on NVDA by purchasing PUT options.
Here’s the full breakdown of the idea, entry logic, and projected targets.
🧠 Why I Entered the Trade
NVDA formed a clear Head & Shoulders (H&S) reversal pattern on the 4H chart — one of the strongest technical reversal signals after an extended bullish trend.
The neckline has now been broken, validating the structure and confirming bearish momentum.
The rejection from the right shoulder, combined with weakening RSI and
Gartley
WheatUsd - correction in uptrendHarmonic pattern and nice place to buy - uptrend and small correction as you can see. Now we are looking for the best price to get in and I think that this is the right one. If price goes to 88.6% Fibo level it would be nice to enter in long position in that moment. Our Take Profit order is far away from that point....
Eth perp/futures bullish gartley Eth is showing signs of a bullish gartley harmonic pattern and just needs to reach the bottom of the channel in the next couple hours to be within acceptable margins for this pattern. The measured move is 2350. Eth has also recently broken out of a falling wedge pattern from its most recent highs at 2800, it tested the support made from breaking out of this patterns upper resistance and bounced off a lower inclined support within a large ascending triangle pattern reaching back to when it was re
S&P 500 Hits Channel Resistance — Is a Sharp Sell-Off Next?The S&P 500 ( CAPITALCOM:SPX500 ) is trading near its All-Time Highs(ATH=$7,825), but the latest price action is showing signs of weakness.
On the 4-hour time frame, the index has reacted negatively to the upper boundary of the Ascending Channel and the major Potential Reversal Zone(PRZ) .
Can the S&P 500 make another attempt at its ATH, or is a deeper correction in U.S. equities approaching?
Macro Outlook
Rising oil prices remain an important risk factor for U.S. equities, particularly if
AAL – Bullish Gartley Reversal | High-Conviction Trade SetupAmerican Airlines is presenting an interesting opportunity on the daily chart, where a Bullish Gartley harmonic pattern has developed near a potential reversal area.
I personally entered this trade yesterday, with a high level of conviction based on several technical indicators aligning with my entry criteria.
While I believe this setup offers attractive upside potential, I want to emphasize that the reversal is not yet fully confirmed.
Trade Setup
Potential Reversal Area: $11.80–$12.30
Inv
NASDAQ TRADE UPDATE: What Happens After the First Reaction?In today’s trading walkthrough, I’m revisiting the bullish Nasdaq idea I shared yesterday and breaking down what happened after price reached our key level.
Price did react exactly where we anticipated, but we never got the full follow-through we were looking for. Now, as price returns to retest our original entry area, we need to start thinking about how the trade could develop from here.
Could this turn into a complex pullback? Is a Gartley pattern beginning to form? And more importantly, ho
FNF bullish Gartley near completion - key reversal zone ahead.FNF is approaching an area that I believe is worth watching very closely. On the weekly chart, there is a developing bullish Gartley pattern with a potential reversal zone around 36.70 to 37.30. That zone comes from Fibonacci confluence, including the 78.6% XA retracement and the 1.618 BC extension on the log scale. The pattern is not complete yet. Price still needs to trade into that PRZ, so at this stage this is a developing setup rather than a confirmed bottom. If FNF reaches the 36.70 to 37.
SODIC - EGX - Action in the way ?EGX:OCDI timeframe: 1 day
Price has formed a bullish Gartley pattern.
Trade setup:
Entry: around 26.50
Stop loss: 24
Targets: 29 – 32
Additionally, a bullish candle pattern has formed on the daily chart.
On the weekly chart, the trend remains upward and strong for long-term investment.
Disclaimer: This is not investment advice, only my analysis based on chart data. Consult your account manager before making any investments.
Thank you, and good luck.
BTC — Bullish Gartley Harmonic PatternBitcoin is setting up for a Bullish Gartley harmonic pattern, with price approaching the Potential Reversal Zone (PRZ) around $81,382.
After the recent move higher, BTC has been consolidating above the PRZ, and this area is where I'm watching for the Gartley to complete and potentially trigger another move higher.
Trade Setup
Entry: $81,382
Stop Loss: $80,415
TP1: $87,324
TP2: $93,830
TP3: $101,500
The $81,382 level is the key area on this chart. If BTC pulls back into the PRZ and holds, I
SILVER — Bullish Gartley Harmonic PatternSilver is approaching a very interesting Bullish Gartley harmonic pattern, with price moving into the Potential Reversal Zone (PRZ) around $59–$60.
This is the area I'm watching closely.
Trade Setup
Entry: $59.00–$60.00
TP1: $67.556
TP2: $71.00
TP3: $76.8425
TP4: $86.00
The $59–$60 area is the key PRZ. If the Bullish Gartley completes here and we get confirmation from price action, I believe this could be a very important area for Silver.
What makes this setup especially interesting is the
BROS — Bullish Gartley Harmonic PatternBROS is approaching a major Potential Reversal Zone (PRZ) where the Bullish Gartley pattern is completing.
The chart currently looks ugly. Price has been falling hard, and at first glance this can look like a falling knife. But this is exactly the type of setup I like to watch when a harmonic pattern is completing at a major PRZ.
Trade Setup
Entry: $34–$36
Stop Loss: $26.00
TP1: $56.00
TP2: $70.00
TP3: $88.00
The $34–$36 area is the key PRZ. This is where the Gartley is expected to complete
RAYA - great fundamental - low risk**@RAYA — 2-hour timeframe**
Prices formatted a Bullish Gartley pattern as follow :.
- Entry: ~7.10
- Stop loss: 7.00 (–1.7%)
- Target 1: 7.64 (+6.9%)
- Target 2: 7.95 (+11.4%)
- Target 3: 8.33 (+16.7%)
Positive MACD divergence supports the setup.
Additionally, 7.10 aligns with a short-term double-top target, making it a strong opportunity to build or add to a position in an up trending stock.
Note: Based on 2-hour chart data only — my personal view, not investment advice. Please consult you
EURUSD — Bullish Gartley Harmonic PatternEURUSD is approaching the Potential Reversal Zone (PRZ) of a Bullish Gartley pattern, with the entry level at 1.12753.
Trade Setup
Entry: 1.12753
Stop Loss: 1.11280
TP1: 1.16595
TP2: 1.18487
TP3: 1.20000
TP4: 1.22500
The 1.12753 PRZ is the key area I'm watching. If price reaches this level and the Bullish Gartley completes with a strong reaction from buyers, this could set up a significant move higher.
The first target is 1.16595, followed by 1.18487. If momentum continues, the larger targe
MSTR: Bullish Gartley With Massive Upside PotentialMSTR has formed a bullish Gartley pattern on the weekly chart, competing around the Potential Reversal Zone.
More importantly, the dashed green trigger has already been triggered, giving the bullish setup confirmation.
Trade Setup
Entry Zone: $110–$120
Stop Loss: $75
Take Profit Targets:
TP1: $305
TP2: $410
TP3: $600
TP4: $900
The Bigger Picture
What stands out here is the potential size of the move.
If MSTR holds the reversal zone and continues higher, the move toward $305 and $410 woul
SUNB — Bullish Gartley SetupSUNB is coming into an area where a Bullish Gartley pattern could give us a nice reversal setup. After the recent selloff, price is now sitting inside the potential reversal zone.
I’m watching two levels closely before considering the setup confirmed.
Confirmation
The yellow trend line is the first one to watch. Price has been respecting this downward trend, so breaking above it would be an early sign that the sellers are losing control.
The second level is the red dotted line at $67.26. Get
ETC: Is This Gartley Setting Up a Reversal?Ethereum Classic is sitting in an interesting spot. We have a bullish Gartley pattern developing near the $7 area, and at the same time, RSI is showing bullish divergence — price is making lower lows while momentum is starting to improve.
But there’s one level I’m watching very closely: the yellow trendline.
That trendline has been acting as a major barrier on the way down. A clean break and hold above the yellow trendline would give this setup much stronger confirmation that the trend may fin
NZDUSD TP 0.5800On the daily chart, NZDUSD encountered resistance and fell back after testing the previous supply zone, forming a bearish Gartley pattern in the short term. Currently, the 0.5890-0.5900 area is worth watching; short positions can be considered if a rebound encounters resistance, with a downside target around 0.5800.
2 Timeframes, 2 Patterns, 1 BIG Opportunity! I’m seeing TWO different technical patterns developing on TWO different timeframes — and they may be telling the same story.
Let’s start on the weekly chart.
Price has recently collapsed from the 2.1680 area all the way down toward 1.8480 before finding a previous level of structure support.
And rather than simply putting in a V-shaped reversal, price has started forming something much more interesting:
A potential Head & Shoulders pattern.
But here's where things get really interesting…
I
#HMSTR +34% The move is finally starting to play out from #HMSTR +34% 🚀
The move is finally starting to play out from the accumulation zone we were watching.
Price has pushed higher from the bottom of the range, and now the important part is whether it can keep holding above the breakout area.
Still watching **$0.00028 → $0.00035 → $0.00050** if momentum continues. 🔥
Gartlly Harmonic Buy Looking for a completion of Gartley HarmoniThe Setup
On the H4 timeframe, a Gartley completion typically occurs at a structural level where smart money has accumulated liquidity. You're likely looking at an order block (previous support/resistance) combined with a fair value gap—the harmonic's D-point should align with where institutional buyers absorbed sell-side liquidity. The pattern itself acts as a confluence zone where multiple SMC structures converge (break of structure, potential liquidity sweep into a killzone).
The Move
Once