Head & Shoulders in Gold before US CPIStory
Gold is testing the neckline of a head-and-shoulders top just hours before Friday's US CPI report.
A stronger-than-expected August jobs report has already pushed the odds of a Federal Reserve rate hike next week above 70%, a day after the European Central Bank delivered a hike of its own. A hot inflation print could tip gold through the neckline, though the volatility it brings may tempt bullish traders to buy the dip soon after.
Technicals
Gold's chart is telling the same story as th
Head and Shoulders
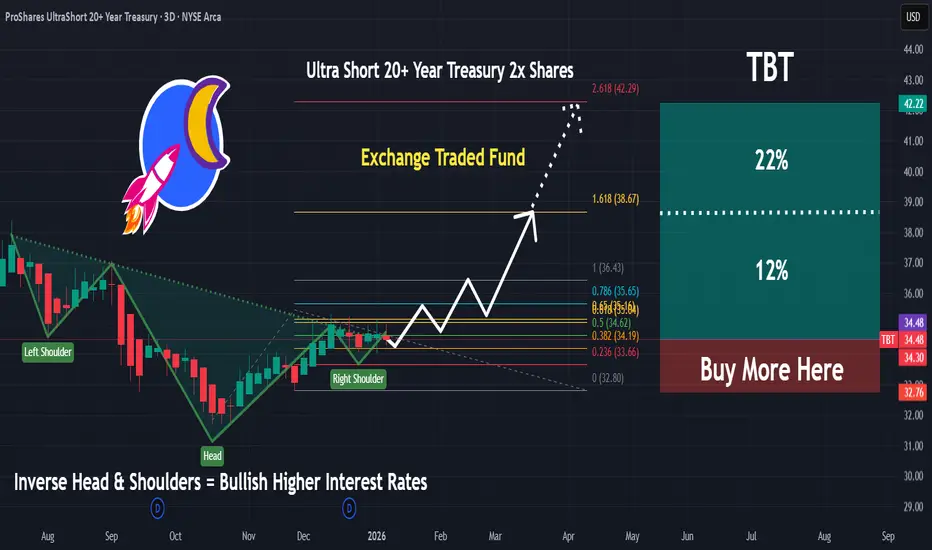
TBT | Expect Interests Rates To Surge | LONGProShares UltraShort 20+ Year Treasury seeks daily investment results, before fees and expenses, that correspond to two times the inverse (-2x) of the daily performance of the ICE U.S. Treasury 20+ Year Bond Index. The fund invests in financial instruments that ProShare Advisors believes, in combination, should produce daily returns consistent with the fund's investment objective. The index includes publicly-issued U.S. Treasury securities with minimum term to maturity greater than or equal to t
XAUUSD: Gold H4 Head & Shoulders Has Broken XAUUSD: Gold H4 Head & Shoulders Has Broken
A Head & Shoulders pattern has formed on the H4 Gold chart, and the neckline has now been broken.
This is an important structural development.
The neckline break gives us a clearer bearish direction for the higher timeframe, but I would not treat this as a simple short-term entry signal.
For me, this setup is more valuable as a directional guide for Day Trading.
Instead of blindly selling after the neckline break, I would rather use the bearis
GOLD (XAU/USD): Very Strong Bearish PatternThe price of 📉Gold is currently testing a firm daily horizontal support level.
The market formed a head and shoulders pattern on a daily time frame.
Please monitor how the price reacts to the neckline of this pattern.
Should a daily candle close below 4385, a bearish movement may be anticipated, with a target price of 4173.
Dollar index ViewAronnoFX will not accept any liability for loss or damage as a result of
reliance on the information contained within this channel including
data, quotes, charts and buy/sell signals
PLZ! LIKE COMMAND AND SHARE
Traders, if you like this idea or have your own opinion about it,
write in the comments. I will be glad
CELO/USDT — Bearish Setup Taking Shape#CELO is currently moving inside a sideways/consolidation zone, but the 30-minute chart is showing several warning signs that could lead to a bearish move.
Head & Shoulders Pattern — A potential reversal structure is forming.
Bearish Divergence — Momentum is weakening despite price movement.
Resistance/Range Structure — Price is struggling to establish a strong bullish breakout.
However, I’m not entering short yet.
The key level to watch is the neckline. A confirmed breakdown and preferably a
XAUUSD: Head and Shoulders Break Signals Potential Move To 4,180Hello everyone, here is my breakdown of the current XAUUSD setup.
Market Analysis
XAUUSD previously formed a clear Head and Shoulders pattern near the highs after breaking out of a wedge structure. Price then tested the Resistance Zone multiple times and was rejected, confirming the bearish shift.
Currently, XAUUSD is trading below the 4,330 Resistance Zone while holding above the 4,180 Support Zone. The completed Head and Shoulders and recent rejection suggest sellers may attempt another mo
Gold (XAU/USD) — Daily Bearish Breakdown | SHORT Setup Technical Analysis
Gold has formed a Head & Shoulders pattern on the daily chart, with the neckline/support zone around $4,262–$4,306.
Price has now broken below this important support area and is trading around $4,195, indicating a potential shift toward bearish momentum.
Key technical levels:
🔴 Resistance / broken support: $4,262–$4,306
⚠️ Current price: ~$4,195
🟢 Next support: ~$4,100
🟢 Major downside support: ~$3,978
🔄 Potential retest zone: $4,262–$4,306
The preferred setup shown on the
BTC/USD × kurutologic: Daily Engulfing & 4 Key ScenariosHey everyone, this is kurutologic.
Today, I'm sharing my updated structure analysis and 4 potential scenarios for BTC/USD on the 4H chart.
(Scroll down for Japanese / 日本語の解説は下部にあります)
■ Market Overview
BTC is currently showing clear warning signs for a corrective move. On the Daily timeframe, we saw a confirmed Bearish Engulfing candle. Meanwhile, lower timeframes (1H) have already completed a double top, and price is being capped by the upper Bollinger Band alongside the heavy Daily Resistance
INV. HEAD AND SHOULDER IN SOMANY CERAMICS- EDUCATIONAL PURPOSESomany Ceramics Ltd is engaged in manufacturing and trading of complete decor solutions, its products include ceramic wall and floor tiles, polished vitrified tiles, glazed vitrified tiles, sanitary-ware, bath fittings and allied products.
Life time high of the stock was around 916 which was formed in Jan 2018 and it was tested in Nov 2021 with new high near 939. How ever it could not sustain there and breakout was failed and stock crashed to 345 till Mar 2026 (-64% correction in 4.5 years).
Th
GOLD (XAU/USD): Pullback Trade ExplainedIt appears that 📈Gold may experience a correction following a test of a key daily/intraday support level.
An inverted head and shoulders pattern on the 4-hour timeframe, combined with a breach of its horizontal neckline, suggests significant buying pressure.
The target is 4340.
EURAUD: Pullback From Resistance 🇪🇺🇦🇺
EURAUD will likely retrace from a major daily resistance cluster.
I see a tiny head & shoulders pattern formation on an hourly time frame
with a breakout of its horizontal neckline as a confirmation.
Goal - 0.6197
❤️Please, support my work with like, thank you!❤️
I am part of Trade Nation's Influencer program and receive a monthly fee for using their TradingView charts in my analysis.
Week 39 of 52 | ORCL: Head & Shoulders at the NecklineNYSE:ORCL has built one of the more interesting weekly structures I’m watching right now.
At first glance, the chart looks messy after such a violent move from the 2025 highs. But zooming out makes the structure much easier to see: a large Head & Shoulders pattern has developed over more than a year.
The left shoulder formed around the $190–200 area. ORCL then pushed to a much higher peak near $330, creating the head, before making one more recovery toward roughly $220–230. That last rally f
EUR/GBP 4H — Inverse Head & Shoulders Breakout | LONGTechnical Analysis
EUR/GBP is showing a developing Inverse Head & Shoulders pattern on the 4H timeframe:
Left Shoulder: around 0.8570–0.8580
Head: around 0.8548–0.8550
Right Shoulder: around 0.8570–0.8575
Neckline / Key Resistance: around 0.8594–0.8600
Price has moved above the neckline area and is currently trading around 0.8605, supporting a bullish breakout structure.
The highlighted 0.8570–0.8575 zone remains an important support area. Holding above this zone would help maintain
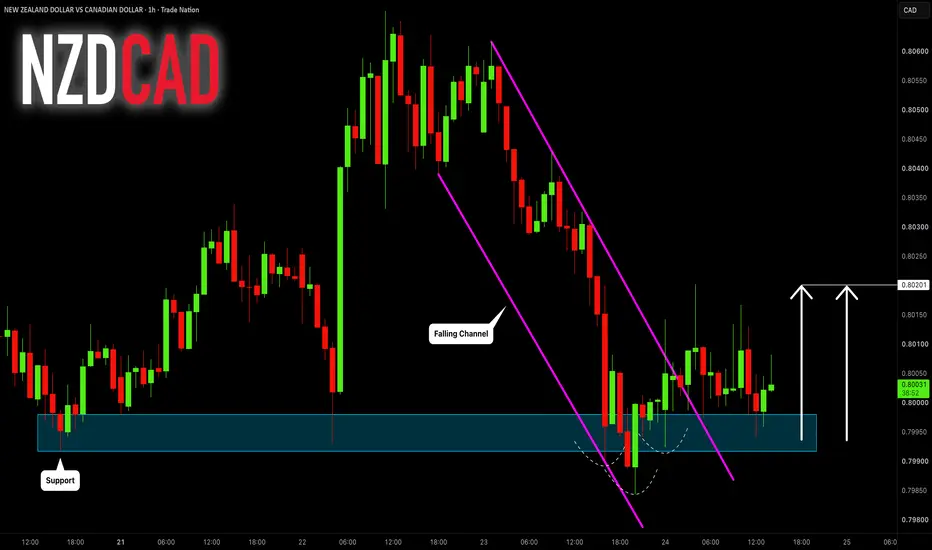
NZDCAD: Pullback From Support 🇳🇿🇨🇦
NZDCAD will likely pull back from a strong intraday support.
As confirmation, I see 2 bullish price action patterns:
an inverted head and shoulders and a falling wedge.
Goal - 0.802
❤️Please, support my work with like, thank you!❤️
I am part of Trade Nation's Influencer program and receive a monthly fee for using their TradingView charts in my analysis.
TECHNICAL ANALYSIS REPORT: USD/INR INVERSE HEAD & SHOULDERSThe USD/INR daily chart is forming a classic Inverted Head and Shoulders (H&S) pattern. This structure indicates a strong potential bullish reversal out of the recent downtrend. The pair is currently trading at 95.91, hovering just below critical breakout resistance.PATTERN STRUCTURELeft Shoulder (Early August): Bottomed out at a structural support shelf near 94.80 before a relief bounce.The Head (Early September): A deeper capitulatory sell-off pushed the pair down to an absolute swing low of 9
GOLD (XAUUSD) UPDATE: THE CALM BEFORE THE STORM?Listen up, traders. If you’re chasing candles right now, you’re gonna get burned. Let’s look at the bigger picture on the 30M chart.
We’ve had a heavy sell-off from the weekly highs, and right now, the market is taking a breather. Look at that purple box—we are currently consolidating in a tight range. This is where retail traders get chopped up, but the smart money is waiting for the breakout.
Here is my game plan for the session:
🔴 THE BEARISH CASE:
We are currently respecting the Previous
QQQ: 50 SMA Cross with Reverse Head-and-Shoulders💡 Swing setup idea
50 SMA Strategy
🔎 Analysis summary:
The technology ETF is reaching resistance while closing a reverse head-and-shoulders pattern. We can also see the crossing of the 50-day moving average, confirming the bullish shift. This alignment of trend, pattern and level makes the breakout area key to watch. The upside potential is projected by the depth of the reverse head-and-shoulders from the breakout point.
👀 Levels to watch:
Entry trigger: Break above $748.65
Target: $836.
NVDA Daily — Inverse Head & Shoulders / Cup and Handle, Needs VoNVIDIA (NASDAQ: NVDA ) — Daily
Setup: Price is tracing out what reads as both an inverse head and shoulders and a cup and handle at the same time — the shape lines up for both. Either way you measure it, the depth points to a similar target: roughly 19-20% upside ($46.47) if price clears the ATH resistance at $236.54 and the pattern plays out.
Supporting the structure: the rising SMA underneath (~$203.63) has been tracking higher lows the whole way through, which lines up with th
NZDJPY H1: Buy Stop Above Key ResistanceNZDJPY is showing signs of a potential bullish continuation after forming a higher high and pulling back into its recent consolidation zone.
The pair remains below the key resistance area at 90.588. Instead of entering early, I am waiting for price to break this level and confirm renewed bullish momentum.
Fundamentally, NZD remains strong, while JPY is trading with a neutral bias. This supports a potential upside move if the technical breakout is confirmed.
Trade Plan:
Buy Stop: 90.588
Head and Shoulders top The target of the head and shoulders top takes the price down to the long term trend line which will act as a key level of resistance. Some 19% fall from today prices
Breakdown of the 200 EMA will cause the price to drop to the next key level of support and this is about 18-19% lower