$INDUSTOWER: From "Debt Trap" to Growth King?🚀💎
Is NSE:INDUSTOWER a solid Double play for the next 18 months?
While many have ignored it, the fundamentals have quietly shifted from "Survive" to "Thrive."
Here’s why the 2x move is on the table:
1. The Vi "Resurrection" 📈Forget the old drama.
Vodafone Idea (Vi) is no longer a liability—it's a growth engine.Debt Fixed:
Vi’s 16-year debt freeze means they finally have cash to pay Indus.
No Overdues: Management confirmed zero pending payments from Vi in Q3.
New Business: Vi’s ₹45,000 Cr expansion means 15,000+ new tenancies for Indus towers.
2. 5G is Printing Money 📶In 2026, it’s not just about building towers; it’s about loading them.
35% of India’s data is now on 5G.
Every extra antenna added to an existing tower is high-margin profit.Massive Scale: 256,000+ towers are already standing. The infrastructure is ready; the cash is coming.
3. The "Double" Roadmap 🗺️Metric )The "Double" GoalP/E Ratio~12x (Cheap!)
24x (Global Standard) Target ➡️ ₹800+
Head and Shoulders
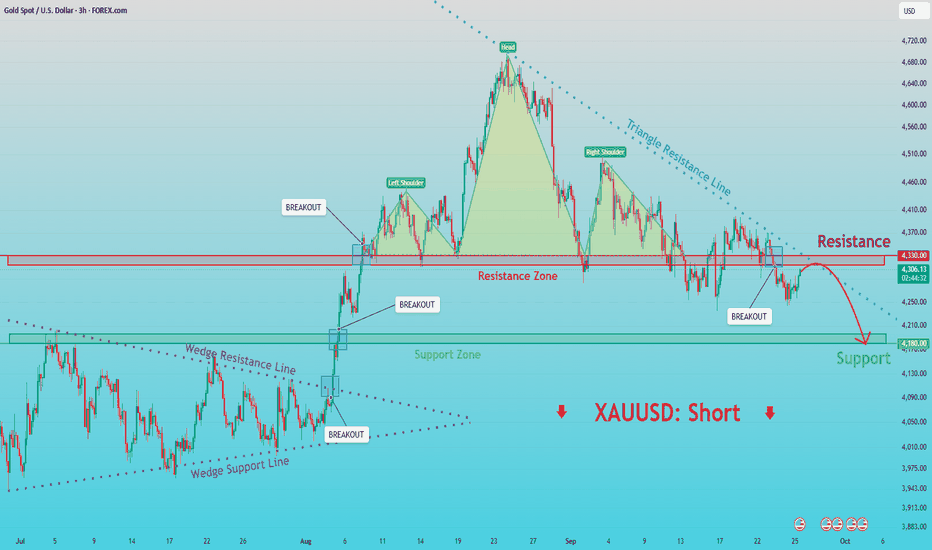
$ITC: Got "Sin Taxed" - Capitulation is nearly here.The Technical Setup: Head & Shoulders Completion
ITC has been a textbook example of a structural breakdown. The massive Head and Shoulders top that formed throughout 2024 and 2025 has fully triggered.
The Neckline: The 390 level was the line in the sand; once that snapped, the technical "gravity" took over.
The Log Target: We are currently hovering right around the 301–304 zone, which represents the logarithmic target of that massive top. This is often where "forced selling" ends and "value buying" begins.
Linear Target: There is a final "scare" level at 281, but the current coiling near 300 suggests the worst of the momentum is fading.
Why the "Worst is Nearly Done" (Growth Drivers):
FMCG De-merger Clarity: The market hated the uncertainty of the hotel de-merger, but as ITC becomes a leaner, FMCG-focused powerhouse, the valuation multiple will eventually re-rate from "Cigarette stock" to "Consumer Staple giant."
The "Value" Yield: At these levels, ITC’s dividend yield becomes irresistible to institutional funds.
We are entering the "Dividend Floor" zone where the stock becomes a bond-proxy for big money.
Agri-Business Resilience: While the cigarette business faces tax headwinds, ITC’s agri and paperboards divisions are quietly building a massive export footprint, diversifying the risk away from the "sin tax" narrative.
The Contrarian Roadmap:
The Accumulation Zone: 281 – 305. This is "generational wealth" territory.
The Rebound Trigger: A weekly close back above 320.
Medium Term Target: A return to the neckline at 390.
Long Term Vision: 480+ (The "New Normal" once de-merger is fully digested).
#ITC #Nifty50 #DividendInvesting #ValueStocks #FMCG #StockMarketIndia #Capitulation #TechnicalAnalysis #BuyTheBlood #Alpha
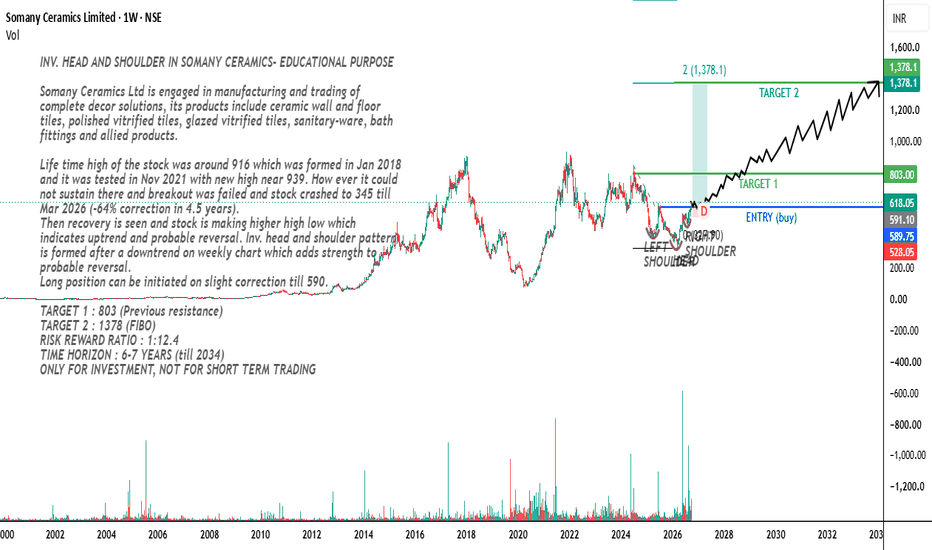
Angel One: Breakout | Target ₹580The wait is over. Angel One (ANGELONE) has spent years building a massive technical base, and the weekly chart is now screaming "Blue Sky Breakout."
Following a classic "Shakeout & Rocket" phase in early 2023, the price action has matured into a textbook Continuation Inverse Head & Shoulders pattern.
We are currently witnessing a high-conviction test of the multi-year neckline at the ₹326–₹330 zone.
Why the setup is prime:
Confirmation Trigger: A solid weekly close above ₹330 invalidates the overhead resistance and confirms the next leg of the primary trend.
Technical Targets: Utilising the depth of the consolidation base, we are looking at a Linear Target of ₹473 and a long-term Log Target of ₹580.
Macro Tailwinds: With the Indian market coiling for a breakout and retail participation hitting record highs, Angel One stands as the primary beneficiary of increasing market depth and operating leverage.
This isn't just a trade; it's a structural re-rating. If the weekly candle holds green above the neckline, the path of least resistance is significantly higher.
#AngelOne #TechnicalAnalysis #TradingView #BreakoutStocks #PriceAction #NiftyNext50 #InvestingIndia #StockMarketIndia
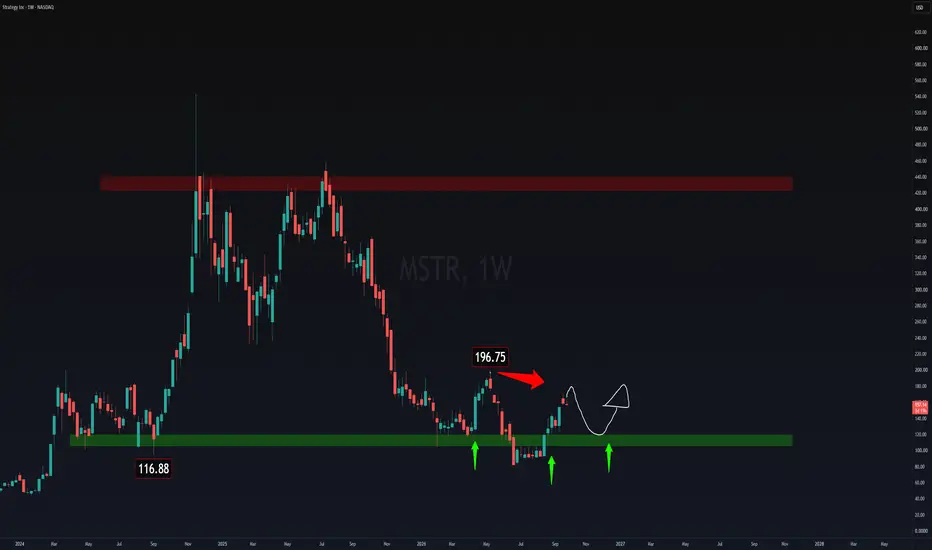
MSTR: Don't be Saylor's ATMLooking at the chart comparing MSTR versus the SPX, you are essentially looking at the "Volatility Multiplier" of the crowd's confidence in Michael Saylor.
The ratio between MSTR and the SPX is not a standard correlation; it is a leverage-adjusted signal.
When MSTR outperforms the SPX (the ratio line slopes upward), it confirms that liquidity is flowing into high-beta, Bitcoin proxy-linked assets.
When the ratio flattens or dips, it indicates that the market is "de-risking"—moving back into stables / broad-market indices like the SPX.
During the "Accumulation" phase of the 4-year cycle, you will often see this ratio consolidate.
During the "Parabolic" phase, the MSTR/SPX ratio tends to go vertical.
The most critical part of this chart is where it intersects with the company's Share Issuance events.
The "Saylor Effect": Historically, MSTR issuance announcements cause a localised dip in the MSTR/SPX ratio (as the market digests dilution), followed by an aggressive recovery if the market perceives the capital deployment as "accretive" (i.e., it buys enough BTC to justify the dilution).
Watch the ratio right after any "ATM" (at-the-market) issuance. If the ratio recovers quickly, the Institutional Bid is strong.
If the ratio stays suppressed, the market is signalling that the dilution is outpacing the value creation.
The Dilution-Dividend Balancing Act: Saylor’s issuance of common shares is a tactical manoeuvre designed to fund the aggressive accumulation of BTC.
However, this is constrained by their commitment to Series A preferred stock (STRC) dividends.
The Constraint: Equity issuance must create "accretive value" (each new share issued must increase the total BTC owned per share).
If the share price drops, issuance becomes dilutive rather than accretive, creating a "downward spiral" of BTC-per-share value.
The "Last Resort" Sales (The Liquidity Tripwire): This is the risk most analysts ignore. If the share price drops to a level where issuing common stock becomes aggressively dilutive, management is forced to either stop buying or sell BTC to fund operations/debt.
* The Projection: A sale of Bitcoin to fund operations would be a fundamental "trend break." It signals that the liquidity engine has stalled.
Keep a close watch on the USD Cash Reserve vs. Preferred Dividend Requirement.
If the cash reserve falls below the threshold required to cover dividends, the likelihood of a "forced sale" of BTC spikes, which would immediately compress the MSTR/SPX ratio.
ORCL: Trendline Broken, Swing Low Lost—Larger Correction Ahead?For months, ORCL respected a strong rising trendline, with every pullback finding buyers before continuing higher.
That bullish structure has now changed.
Price has broken below the long-term trendline and, more importantly, has also closed below the recent swing low near 134, confirming a break in market structure.
To make matters worse, the overall price action appears to be forming a Head & Shoulders pattern, suggesting the recent weakness may be more than just a normal pullback.
🐻 Bearish Factors
📉 Trendline Breakdown
⚠️ Market Structure Shift
🎯 Head & Shoulders Pattern
The current structure resembles a classical Head & Shoulders reversal, with a measured downside target in the low 50s (if fully completed.)
🔄 Support Turned Resistance
Unless buyers quickly reclaim the breakdown levels, rallies are likely to face selling pressure.
🎯 Bearish Scenario
➡️ As long as ORCL remains below the broken trendline and recent swing low, I expect the correction to continue.
🎯 Target 1: 116 (Strong Intermediate Support)
🎯 Target 2: 95 (Major Support Zone)
📉 Extended Target: Low 50s (Head & Shoulders Measured Move)
⚠️ What I'm Watching
👀 Before turning more aggressive on the bearish side, I'll be watching for:
✅ Failure to reclaim 134
✅ Rejection from the broken trendline
✅ Increasing selling volume
✅ Continued weakness below key moving averages
Those would strengthen the probability of a larger decline.
❌ Bearish Invalidation
🟢 A strong daily close above 150 would invalidate this bearish thesis, suggesting the breakdown was a false move and buyers have regained control.
💡 For now, the technical picture has shifted strongly in favor of the bears. Unless ORCL quickly reclaims its lost support levels, the path of least resistance appears lower, with 116 and 95 as the first key downside objectives before the larger Head & Shoulders target comes into focus.
NAS100 |Bullish Inverse Head & Shoulder|Waiting for Confirmation#NASDAQ 100 is developing a Inverse Head & Shoulders pattern on the 1-hour timeframe, indicating that buyers are gradually taking control after a healthy correction.
Technical Overview
Clear Inverse Head & Shoulders formation
Higher lows showing increasing bullish momentum
No significant bearish structure or reversal signal at the moment
Price is approaching the neckline resistance
Trading Plan
I'm not chasing the breakout. The high-probability setup is:
* Wait for a strong breakout above the neckline with solid volume.
* Let the price retest the neckline as new support.
* Enter a long position only after bullish confirmation on the retest.
* Always use a proper Stop Loss below the invalidation level and maintain disciplined risk management.
Patience is the edge. Many false breakouts occur before the real move begins. Waiting for confirmation can significantly improve the probability of a successful trade.
What's Your View?
Do you think #NAS100 is ready for the next bullish leg, or will the neckline reject the price once again?
Share your analysis in the comments!
If you found this analysis helpful, please boost, like, and follow for more high-probability technical setups and market insights.
#NAS100 #NASDAQ #US100 #TechnicalAnalysis #InverseHeadAndShoulders #PriceAction #Breakout #TradingView #RiskManagement #DayTrading #SwingTrading #ChartPatterns #Bullish #TradingIdeas
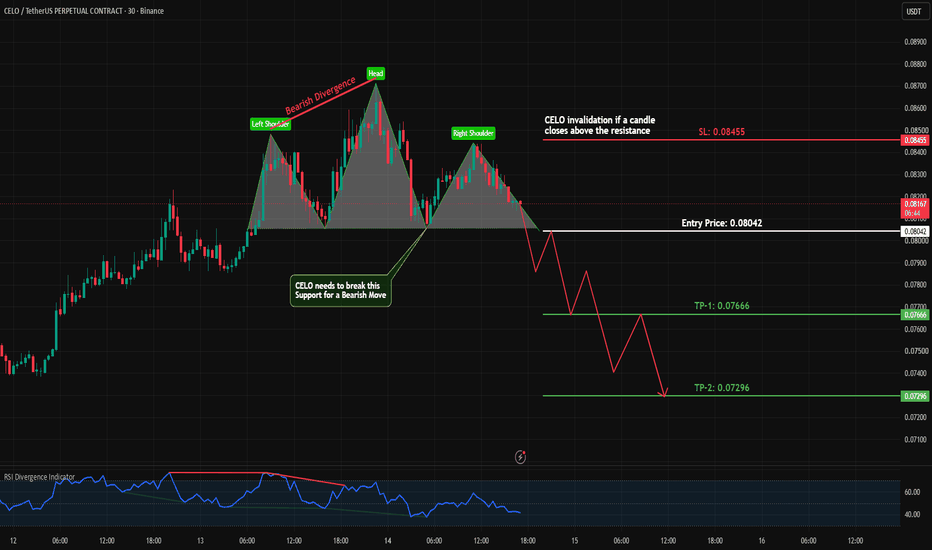
BTCUSDT.PPrice remains inside the premium zone but is now trading near its lower boundary after breaking the 1H MSB and flipping the bands bearish. The 1H Order Block continues to hold as support despite multiple tests. Price action is forming lower highs and lower lows, with a potential Head and Shoulders developing, although it is not yet confirmed. Volume has contracted during consolidation, suggesting compression before the next impulsive move. A break below the Order Block would strengthen the bearish case, while reclaiming the moving averages and 64,671 would restore short-term bullish momentum.
ASX 200 eyeing a pattern breakoutWe have some interesting price action brewing on the ASX 200.
Although a pullback from 8,983 occurred following the break of a double-bottom pattern’s neckline at 8,811, price is beginning to find a footing without breaching the pattern’s lows of around 8,485. The pattern’s profit objective is still calling for attention at 9,128.
Additionally, you may acknowledge the potential inverted head-and-shoulders pattern now forming, with the neckline at 8,900. A break above here may help reaffirm bullish intent from the double-bottom formation, targeting the said profit objective of 9,128.
Written by FP Markets Chief Market Analyst Aaron Hill
Solana Price Prediction Amid Crypto Bullish OutlookSolana (SOL) is poised to reclaim its $250 all-time high, according to one long-term analysis of the 3-day SOL/USDT higher-timeframe chart.
Solana chart forecasts strong upside momentum to $250
As seen in the chart below, Solana appears to be carving out a robust, long-term accumulation pattern that could catalyze massive upward momentum. The analyst emphasizes “zooming out” to filter out minor market volatility and focus through a macroscopic lens.
At the time of writing, SOL was trading at $77.51, implying that a move to $250 would require a 220% increase. To achieve this, SOL buyers must first aggressively absorb supply to overcome several resistance zones.
Add Coinpedia as a trusted source in Google News
SOL price chart
The first is the $79-$85 congestion zone, where more than 105 million tokens have historically changed hands. Breaking past this zone would invalidate near-term bearish movement and build confidence around a breakout to $250.
Another key resistance zone is the $100 psychological barrier, which is currently a multi-month ceiling. Crossing above the three-figure mark would pave the way for a mid-term extension to $120-$150, and eventually to $200.
Ecosystem developments
Since October 2025, institutions have been continuously applying for Solana exchange-traded funds (ETFs). Just yesterday, Morgan Stanley updated its filing for a Solana ETF with the US Securities and Exchange Commission (SEC).
Even more, while Ethereum leads in terms of asset tokenization, institutions prefer Solana for its high throughput and lower gas fees. The network also eliminated any chance of outages through last year’s Firedance upgrade. Even more, Solana offers a unique staking advantage in its ETFs as compared to Ethereum.
Beyond sustaining high trading volumes, these developments are key to maintaining the magnitude of the rally mentioned above.
The outlook
That said, Solana could experience near-term resistance and consolidation, even as long-term structural momentum continues to brew.
Additionally, Solana buyers need to maintain prices above the $74-$75 baseline to invalidate false breakdowns and establish a springboard for localized rebounds. Should this fall through, the lower Bollinger Band suggests a deeper retest down to $68.57. Prolonged trading below $70 has historically led to price consolidation in a strict range prior to recovery.
Navin Fluorine – Inverted H&S Breakout SetupSetup: 1‑hour chart showing a Head & Shoulders formation with neckline breakout potential.
Current Price: Around ₹7,800 projection zone.
Trend Context:
Left Shoulder, Head, Right Shoulder clearly defined.
Moving average support aligning with breakout zone.
Long/Short signals marking trader interest.
Why Traders Care:
Head & Shoulders is a classic reversal pattern.
Breakout above neckline often signals strong upside.
Volume confirmation adds conviction to the move.
My Take: Navin Fluorine is flashing a bullish reversal — sustaining above neckline could open the path toward ₹7,800.
Community call: Will Navin Fluorine confirm the breakout or stall at resistance? Share your view.
ETHUSDT | Potential Breakout Toward $2,260Ethereum is trading near a key technical zone, with an inverse head and shoulders pattern approaching confirmation.
✅ Entry confirmation: 4H candle close above the $1,850 neckline
❌ Invalidation: 4H candle close below the $1,850 neckline
🎯 First resistance: $2,000
🎯 Second resistance: $2,150
🚀 Main target: $2,260
🛑 Stop loss: 4H candle close below $1,750
A confirmed breakout above the neckline would strengthen the bullish setup and could open the way toward $2,000, then $2,150, with the full pattern target near $2,260.
There is also a descending trendline overhead, so price may face pressure before reaching the full target. If buyers maintain control above the neckline, that would improve the probability of continuation.
On the other hand, a daily close below $1,750 would weaken the setup and invalidate the bullish scenario.
The setup depends on confirmation — not just a temporary move above the neckline.
#ETH #Ethereum #ETHUSDT #Crypto #TechnicalAnalysis
This is technical analysis for educational purposes, not financial advice.
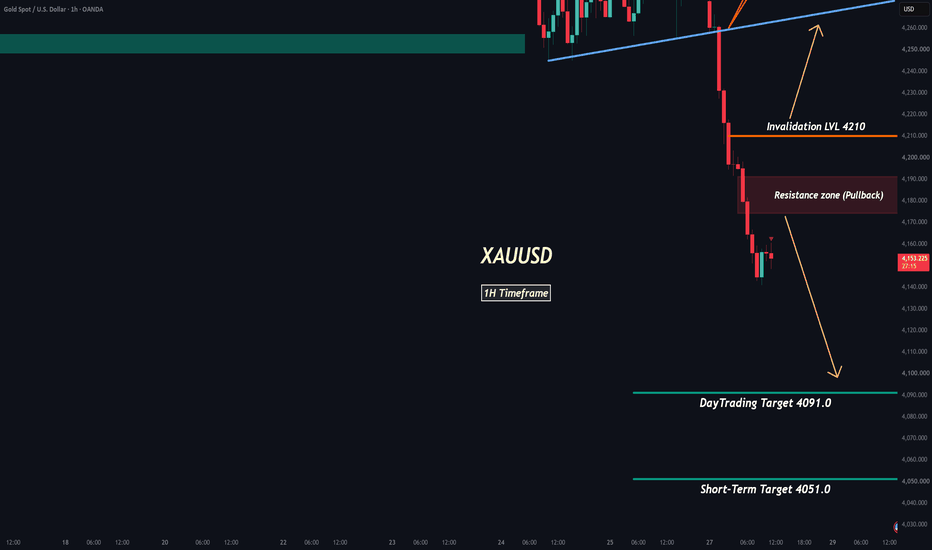
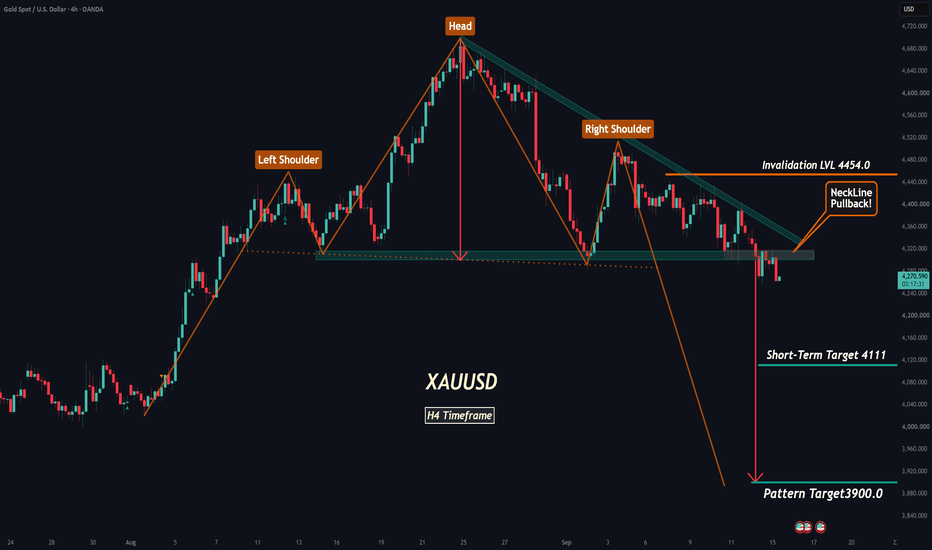
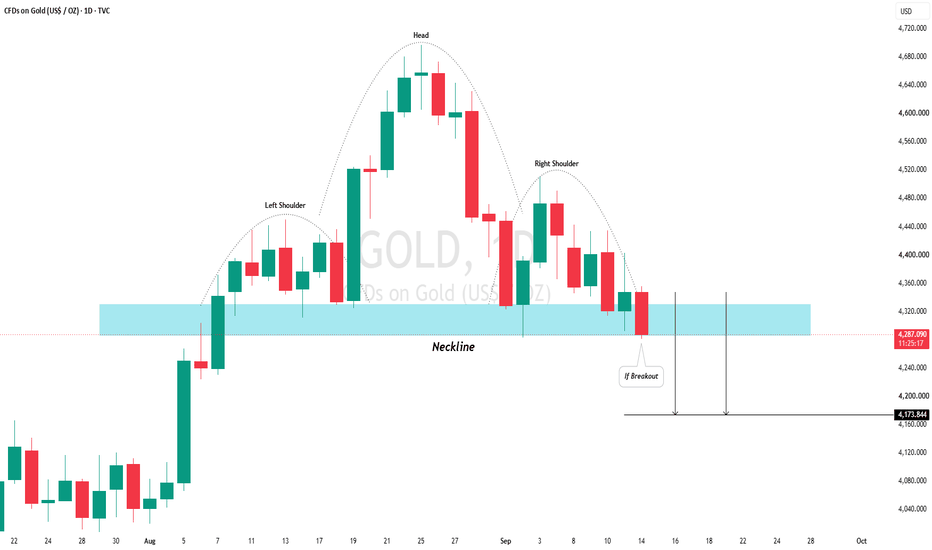
GOLD (XAU/USD): Strong Bullish SignalThe price of 📈Gold formed an inverted head and shoulders pattern on the hourly timeframe, following a test of a significant intraday horizontal support level.
A bullish breakout from the horizontal neckline of this pattern on the hourly chart suggests a clear display of buyer strength.
The target is 4054.
NZD/USD has formed a potential head-and-shoulders bottomOn the daily chart, BTCUSD has stabilized after rebounding from lows, with short-term price action forming a potential "head and shoulders bottom" pattern. Attention should be focused on the resistance near 67,253; a breakout could trigger an upward move. In the short term, look for long-entry opportunities in the 62,000–62,800 zone.
Inverted H&S pattern in PLTRLeft shoulder low: ~$127
Peak between LS and Head (left neckline): ~$136-137
Head low: ~$107
Right shoulder low: ~$128-129
Current price: $134.19 — still inside the pattern, approaching the neckline
The neckline at ~$136-137 has NOT been broken yet. At $134, price is still ~$2-3 below the neckline. So this is still a pending IH&S breakout, not a confirmed one. That's actually more
A 2h close above $137 with above-average volume confirms the pattern.
Neckline ~$136.50, Head low ~$107 → height = ~$29.50
Target = $136.50 + $29.50 = ~$166
ZECUSDT | Potential Breakout Toward 800$Zcash (ZEC) is trading at a key technical level, with an inverse head and shoulders pattern taking shape and price approaching a breakout above the neckline at 544.28.
✅ Entry confirmation: 4H candle close above 544.28
🎯 First resistance: 630
🎯 Second resistance: 690
🚀 Main target: 800 — around +46% upside
🛑 Stop loss: 4H candle close below 490 — around -10% risk
Holding above the neckline would turn the 544 area into potential support and could open the way toward 630, then 690, and possibly the full measured move to 800.
On the other hand, a 4H close below 490 would invalidate the bullish setup and cancel the breakout scenario.
Zcash remains one of the well-known privacy-focused cryptocurrencies, which can sometimes attract attention during periods of renewed altcoin momentum. Still, volatility remains high, so confirmation is essential before entering.
The idea depends on confirmation — not just touching the neckline.
#ZEC #Zcash #ZECUSDT #Crypto #TechnicalAnalysis
AVAX PRESSURE IS BUILDING — BREAKOUT OR TRAP?Yello Paradisers! Are you prepared for a potential sharp move on #AVAX, or are you still underestimating what’s quietly building behind the scenes? At first glance, this structure might seem like a simple and healthy pullback. But when we strip away emotions and analyse the chart objectively, a completely different narrative emerges. This is not random price action — this is a high-risk, high-opportunity zone where discipline matters far more than opinions.
💎#AVAX has recently printed a classic selling climax, followed by a climactic action candle supported by ultra-high volume. This is a textbook indication of accumulation. Historically, this exact behaviour appears when smart money begins positioning ahead of a larger move. While subtle to the untrained eye, this probability carries significant weight for experienced traders.
💎#AVAX has swept the lower trigger line of the selling climax and followed it with a strong momentum candle closing back within that trigger zone. It suggests that weak hands are being forced out, while stronger participants are stepping in with conviction. we have also seen a two-bar reversal forming near the bottom after the selling climax, adding another layer of bullish confluence. The most important level to watch now is just above the high of the climactic action candle. A confirmed breakout, supported by strong momentum, could open the path toward 9.700, which stands as a major structural resistance level.
💎#AVAX continues to respect its descending support trend-line. The recent price action has also formed a potential inverse head-and-shoulders pattern, while the RSI is showing a clear bullish divergence. Together, these confirmations strengthen the probability of bullish scenario, As long as prices maintains momentum inside the demand zone, the structure remains constructive. The first major resistance level to monitor is 8.500.
💎If #AVAX fails to hold bullish momentum and a momentum candle closes below 5.400, the current bullish probability becomes invalid. In that case, we could see further downside pressure.
That is why Paradisers, we are playing it safe right now. If you want to be consistently profitable, you need to be extremely patient and always wait only for the best, highest probability trading opportunities only on confirmations.
MyCryptoParadise
iFeel the success🌴
ETHEREUM (ETH/USD): Strong Bullish PatternThere is a strong likelihood that 📈ETHEREUM will continue its upward movement.
The formation of an inverted head and shoulders pattern, following a test of a critical support level and a subsequent breakout above its neckline, presents a strong bullish signal.
Our target is 1810.
USDCAD: Massive Triple Breakout Complete, the Next Leg UpHi!
This USDCAD setup is looking incredibly bullish after clearing multiple major technical structures at once. We officially have three massive confirmations on the daily chart:
The long-term descending trendline is broken,
The inverse head and shoulders pattern is broken,
And the massive macro double bottom neckline has finally been cleared.
Right now, the price is trading around 1.41290 and starting a healthy correction back down. I'm expecting this short-term pullback to retest the broken neckline area, which should act as strong support and give us a solid base for the next push.
Once this correction finishes and buyers step back in, I am targeting two main levels on the way up:
Target 1: The Inverse Head and Shoulders target resting right around 1.43000.
Target 2: The macro double bottom target up at the 1.45500 mark.
Just waiting out this temporary pullback to catch the continuation higher.
I’m excited to announce that I’m now a Brand Ambassador for AvaTrade!
BTC | The Inevitable Collapse of Bitcoin to Sub-$20K | SHORTHISTORY IN THE MAKING: The Inevitable Collapse of Bitcoin to Sub-$20K (And Why Saylor Got It Wrong)
Traders, we are currently witnessing the greatest distribution phase in modern financial history.
With Bitcoin hovering precariously around the $64,000 mark after its staggering collapse from the 2025 highs, the retail crowd is desperately clinging to the hope of a "bull flag" or a "healthy correction." Let me be crystal clear: this is not a dip to be bought. This is the structural unwinding of a decade-long liquidity bubble, and the charts are screaming that a return to sub-$20,000 is not just possible—it is the highest probability outcome.
We are looking at a macro-driven death spiral, and the very narratives that pumped this asset to the stratosphere are currently collapsing in real-time. Here is exactly why the bottom is going to fall out, why the corporate treasury model is fundamentally flawed, and what the charts are secretly telling us.
The Michael Saylor Delusion: Why the "Never Sell" Promise Fractured
For years, Michael Saylor and MicroStrategy have been the ultimate cheerleaders of the Bitcoin super-cycle, operating under a seemingly invincible thesis: borrow cheap fiat, buy digital gold, and hold forever. But his entire model was predicated on an era of Zero Interest Rate Policy (ZIRP) and infinite market liquidity.
Here is why Saylor’s thesis was fundamentally wrong:
The Leverage Trap: Saylor treated Bitcoin as a pristine collateral asset that would perpetually outpace the cost of debt. But in a higher-for-longer interest rate regime driven by sticky inflation, the cost of servicing corporate debt becomes a massive liability. You cannot out-yield 5%+ risk-free rates with a non-yielding digital asset that is bleeding momentum.
The "Never Sell" Vow Was Broken: The cracks are already visible. The recent symbolic sale of Bitcoin by MicroStrategy completely shattered the psychological foundation of their "diamond hands" narrative. When the biggest institutional whale capitulates—even slightly—it signals to the rest of the market that the treasury model is under extreme stress.
The Forced Unwind: When an asset drops 50% from its peak, the corporate treasuries heavily leveraged in it face immense shareholder and debt-covenant pressure. Saylor’s strategy only works in one direction. In a prolonged macro bear market, it turns into an accelerated liquidation loop.
The Divergence Seeker’s Blueprint: Why the Technicals Demand Sub-$20K
As a divergence seeker, I don't listen to the news; I listen to the momentum. And the higher-timeframe charts have been flashing blindingly red warning signs that the masses have completely ignored.
Generational Bearish Divergence (Monthly/Weekly RSI): If you zoom out to the weekly and monthly timeframes, the story is terrifying. When Bitcoin pushed to its all-time highs above $120K in 2025, it did so on significantly lower momentum. The RSI and MACD printed massive lower highs while the price printed higher highs. This is a textbook, multi-year bearish divergence indicating total exhaustion of the bullish trend.
Volume Divergence: Look at the volume profile on the advances over the last 18 months. The volume has been steadily declining on the way up, meaning the moves were driven by thin liquidity and derivatives leverage, not genuine spot accumulation. Now, as the price breaks down, volume is accelerating.
The Hidden "Smart vs. Dumb Money" Divergence: We are seeing a massive divergence between institutional flows and retail sentiment. Record-breaking outflows from Bitcoin ETFs are draining the system of structural bids. Smart money is heading for the exits and rotating into AI equities, real cash-flowing assets, and physical gold, leaving retail to hold the bag on a declining digital ledger.
The Macro Guillotine: The Catalyst for the Final Flush
The 2022 collapse was driven by crypto-specific contagion (FTX, Luna, Celsius). The current and coming collapse is much more dangerous because it is macro-driven.
The Fed’s Stranglehold: The Federal Reserve’s hawkish stance and refusal to pivot back to easy money means the liquidity hose is turned off. Bitcoin is trading strictly as a high-beta proxy for global liquidity. No liquidity, no Bitcoin bull run.
Geopolitical Flight to Real Safety: In times of escalating global tension, capital flees to established safe havens (the US Dollar, Gold). Bitcoin was tested as a safe haven, and it failed the test, trading instead like an over-leveraged tech stock.
The Halving Myth: The narrative that the halving would mathematically force the price to a million dollars has been thoroughly debunked. The reduction in miner rewards is a drop in the bucket compared to the massive macro outflows we are witnessing.
The Road Ahead
The breakdown of the rising wedge on the lower timeframes is just the beginning. The $60,000 support level is fragile and heavily tested; the more a support is tested, the weaker it becomes. Once the $50K psychological barrier gives way, the long liquidations will cascade.
The $40,000 base-case floor that mainstream analysts are currently projecting is far too optimistic. When the corporate treasuries are forced to de-risk, and the ETF exodus accelerates, the resulting capitulation wick will slice straight through the $30K mark, finding ultimate structural support back at the 2022 lows—sub-$20,000.
History is being made right now. Protect your capital, respect the divergences, and don't get caught holding the bag for the billionaires who are quietly hitting the bid.
Trade safe, stay objective, and follow the momentum.