Bitcoin enters week Gaussian channel - September 2026Next stop: $95-96k with 100% probability.
Do you remember this idea?
At that time price action printed a candle body inside the channel around 101k on the weekly chart. Fairly unpopular amongst the Bitcoin maxis to tell them precious was going down.
Price action has now confirmed the channel once more. And the 100% ??
“At its core statistics is not about cleverness and technique, but rather about honesty.”
as my professor in operational research used to quote me.
Statistics also say most people die in hospital.. so stay away from hospitals. It’s not wrong, but you go there when you need to and people buy market tops because they must. Ask the maxis.
The also sell the bottoms, just like Tech lead..
If you can bring yourself to part with the fundamental mumbo jumbo, I’ll lay on the facts. Facts with confluence.
The Gaussian channel on the week after a bull / bear market.
Each of the weekly charts below has price action entering the channel after:
The end of a bull market
The end of a bear market
The all make this distinction short after the recently reported death cross. The would be the confluence mentioned earlier.
March 2023
April 2019 & March 2020
October 2015
But there’s more, $95-96k, why are you so certain?
That annoying subject again, statistics. Some say this is no strategy at all. You know who you are. Take another glance at the above charts, what do you see?
Every time price action enters AND confirms the entry (it has), price action will continue until the upper side is tested. Most assets do this, stock, crapto, Bonds, price of Hong Kong fishcakes. For the high majority of the time the statistic will play out. Bitcoin has a track record of 100% as measured throughout all price action history available.
Summery, no short selling amigo.
Is $95-96k the next market top?
No.
Do you know what it is?
Certainly do. A flex not many can make. Annoying isn't he?
It was the exact same process used to call the market to at strike120k from around 18k.
Do you know what that process was?
Some of you do, some of you don’t. If you’re meant to know, you will. If not, social media has done its work on you.
Is it possible for price action to reverse and test the lows? For sure.
Is it probable? No.
Ww
====================================================
Disclaimer
Past observations are evidence, not guarantees. A statistical pattern can have a 100% historical hit rate and fail on the very next observation. That's statistics. Irritating, isn't it?
Markets contain risk. Bitcoin contains quite a lot of it. Price can rise, fall, reverse, collapse, overshoot, undershoot, or spend three weeks doing absolutely nothing simply to make everyone involved look stupid. So don't buy because I said $95-96k. Don't sell because I said $95-96k. Don't leverage your grandmother because I said $95-96k.
Do your own analysis, understand your risk, and make your own decisions. And if Bitcoin doesn't reach $95-96k, congratulations: you've just witnessed the historical statistic change from 100%.
Science marches on.  Long
Long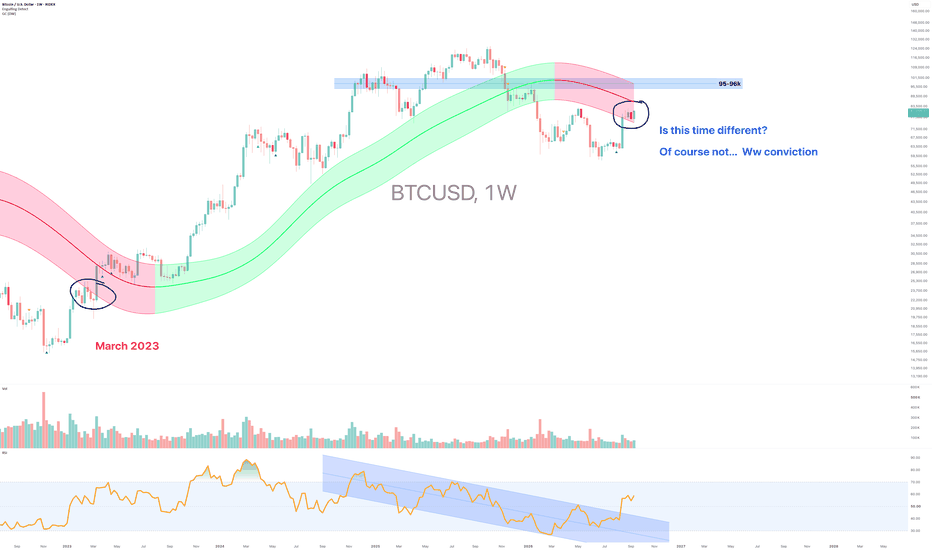
Bitcoin Daily | The Structure Is Still the Story⏱️ Reading time: About 3 minutes
On the Bitcoin Daily chart, the main question for us is not simply whether price is going up or down.
The more important question is:
What is the current structure telling us?
From the major low marked on the chart, Bitcoin has developed a significant upward move. Now, we are watching one of the most important structural decision points in the market.
Scenario 1: Bullish Case
In the bullish scenario, the current upward move could be part of a larger impulsive structure.
First, we want to see this current structure develop and eventually complete. After that, a correction would be normal.
A correction does not automatically mean that the bullish structure has failed.
If the correction is followed by another impulsive move, a Leading Diagonal, or even a smaller nested 1–2 structure, that could provide important evidence for further upside.
The area around $126,255–$126,272 is especially important.
A valid break above this area could provide the first meaningful confirmation of the bullish scenario.
If the structure continues to support this scenario, the next structural targets shown on the chart are:
$168,628 → $195,184 → $237,116
These are not predictions or guarantees.
They are simply potential structural targets based on the current Elliott Wave scenario.
Scenario 2: Bearish Case
The bearish scenario is still possible.
If the current upward move fails to develop into a valid impulsive structure, and price begins forming another corrective structure, this could mean that the current rally is only part of a larger correction.
In that case, the 50%–61.8% retracement area becomes important, followed by the 61.8%–78.6% zone.
And there is one important point to remember:
One five-wave move alone is not enough to confirm a bullish trend.
For us, the sequence is more important:
Impulse → Correction → New Impulse
If this sequence develops according to Elliott Wave rules and guidelines, the bullish scenario becomes stronger.
If it doesn't, we simply reassess the structure and allow the market to show us what comes next.
The $15,479 level remains our major bullish invalidation level on this chart.
So as long as the larger structure continues to respect this level, the broader bullish possibility remains structurally valid.
And perhaps the most important idea is this:
We don't try to force the market to fit our count.
We adjust our count to fit the market.
Patterns whisper. I listen.
— Mr. Nobody 🎧📊
Bitcoin
Jun 22, 2023
Strong bullish cryptocurrency market???YES
Short 
Ethereum Weekly | One Larger Structure, Two Scenarios⏱️ Reading time: About 3 minutes
On the Ethereum Weekly chart, it helps to step back from the short-term price movements and focus on the larger market structure.
From the beginning of the chart, we can follow a larger impulsive structure, where waves I, II, and III are marked at their respective degree.
After the formation of III, the market entered a more complex corrective period, with several swings developing along the way. The main question now is whether this larger correction is approaching completion or still needs more time and structure to develop.
At this point, we are following two scenarios.
Scenario 1: Bullish Case
In the bullish scenario, the larger corrective structure may be approaching completion, and after (IV) is complete, the market could begin a larger upward move.
The first thing we want to see is an Impulse Pattern — Five Waves Up.
In other words, the market needs to develop a valid five-wave structure from the current area.
In this scenario, the initial move could be only the beginning of a larger structure, followed by intermediate corrections before the upward movement continues.
The 2,597.17 area is important as our Bullish Confirmation level. Holding the structure above this area could provide additional evidence for the bullish scenario.
If this structure continues to develop, the potential targets shown on the chart are:
19,534 → 39,407 → 96,606
These are not guaranteed price predictions. They are potential structural targets based on the wave relationships within this scenario.
Scenario 2: Bearish Case
The bearish scenario remains on the table as well.
If the current move fails to develop into a valid impulsive structure and the market enters another Big Correction, the larger corrective structure may still need more time to develop.
In that case, the current count could still represent only part of the larger correction, meaning the market may need additional time and price movement before a larger bullish cycle begins.
For us, reaching a specific price level is not the only thing that matters.
How price reaches that level matters even more.
If the market develops five waves upward, followed by a proportional correction, and then forms another impulsive structure, that sequence could provide important evidence for the bullish scenario.
But if the structure remains corrective, we will reassess the count based on the new market evidence.
Another important point on this chart is wave degree.
For example, I, II, and III belong to one degree, while (III) and (IV) represent a higher degree within the larger structure.
Therefore, we should not compare waves simply by their visual appearance. Degree, proportion, time, and internal structure all matter.
Ultimately, this is what matters most in our analysis:
We don't try to predict the path. We follow the structure.
If the bullish structure is confirmed, the turquoise scenario shows one possible path.
If the corrective structure continues, the black scenario remains under consideration.
In the end, the market itself will tell us which structure is developing.
Patterns whisper. I listen.
— Mr. Nobody 🎧📊
Ethereum
7 days ago
ETH/USD | The Hidden Structure of Wave V
Ethereum
Jul 11
Ethereum | Is the Largest Corrective Cycle Nearing Completion?
 Long
Long
 Long
Long
FET to the moon - September 2026Already this idea has been written twice, click on the little triangles on the above chart (proof of publish point) or the links below. Same destination.
The Long in Aug 2023
Most were debating an entry of 27 cents at the time over a published 19 cents for a multi dollar forecast. No words. If that's you today... don't quit the day job. You're in the wrong business.
The Short in April 2024 - after 2000%
The comments.. let’s just say the folks that left remarks “no way”, bought more at $3 and are now probably selling at 17 cents. 95% of market participants.
Want to be the 5%?
Then you're grabbing every dip the market offers you.
Why Long in September 2026?
For the same reasons as the previous long then short ideas. Questions 1 and 2. No other reason.
Master support and resistance and you’ll understand those reasons. Don’t just get "good” at it, really master the skill and you can forget every other single indicator on the platform. Nothing is more powerful.
Most folks probably believe this long Bitcoin idea @ $63k was the result of two moving averages... partly. The confidence came from observing support and resistance as was discussed in a video a couple of month ago.
Is it possible FET price action will continue dropping? Sure.
Is it probable? No... why?.. seriously?
Ww
Strong bullish divergence.
My divergence tool before you ask:
======================================================
Disclaimer
Look, I actually have to type this out because society has reached a point where we have to print "do not drink" on bottles of bleach.
This isn't financial advice. If you decide to remortgage your house and dump your kids' university fund into magic internet money because a bloke on a forum drew some little triangles on a chart... you shouldn't be allowed to manage your own trousers, let alone a trading account. Seriously. If you lose everything, do not come crying to me. I don't care.
I am simply showing you what I see. I'm pointing at the bleeding obvious. If you blindly copy this and get liquidated because you haven't got the faintest clue how a stop-loss works, that is entirely your fault for being thick. I'm not a licensed financial advisor, just someone who actually bothered to learn support and resistance while the rest of you were busy buying the top.
Trade at your own risk. Or don't. Keep being the 95% who buy high, sell low (like Tech Lead), and blame the universe. It's actually quite funny to watch. Cheers.  Long
Long
 Long
Long
Crude Oil | What Is the Current Wave Structure Telling Us?⏱️ Reading time: about 2 minutes
In our previous oil analysis, the main question was:
What structure is the market building?
Now, after a few more days of price action, the internal structure is giving us more information.
In the previous analysis, we looked at the advance as a possible part of a higher-degree Wave III, with 105.80 as an important confirmation level.
In this update, the internal structure is becoming more detailed.
The recent move can now be viewed as a sequence of Wave 1 and Wave 2, followed by the development of Wave 3. The latest correction is also showing the characteristics of a three-wave corrective structure.
In the bullish scenario, holding this structure could keep the path open for further development of Wave 3.
For now, 102.996 is the current confirmation level, while 104.753 is the first important structural target.
If the bullish structure continues, 127.970, 142.314, 151.066, and 165.653 can be monitored as the next reference areas.
But there is another important point.
If the market moves into a deeper decline, a three-cycle structure could become relevant again. However, for that scenario to develop into a larger-degree bearish structure, the market would need to decline much further.
In that case, 79.347 and then 72.423 become important levels to watch, while 54.877 remains a major boundary for the larger bullish structure.
So compared with the previous analysis, the main question has not changed:
“Where is the market going?” is still not the question we are trying to answer.
The real question is:
“What is the current structure developing into?”
A few days of price action do not necessarily change the larger scenario.
Sometimes, they simply help us see what is happening inside the structure more clearly.
We don't follow predictions.
We follow structure.
Patterns whisper, and I listen.
— Mr. Nobody 🎧📊
Brent Crude Oil
4 days ago
Brent Crude Oil | Is Wave III Expanding?
WTI Crude OIL vs US Dollar
3 days ago
Crude Oil | Is Wave 3 Expanding?
🇪🇺🇺🇸 EUR/USD | When Structure Reveals the Next Path⏱️ Reading time: about 3 minutes
In this analysis, we are taking a closer look at the EUR/USD structure—especially the movement that developed after the recent historical low, and what price may currently be building at the lower degrees.
From an Elliott Wave perspective, it is not enough for us to simply ask whether price will ultimately move higher or lower. The more important question is:
What structure is the market building right now?
From the major market low, a significant upward move developed, followed by a corrective phase. In the bullish scenario, this correction may still be part of a larger corrective structure. Therefore, we do not want to make the decision before the market itself gives us enough structural evidence.
🟦 Scenario 1 — Bullish Case
In the bullish scenario, if the current correction can complete as a three-wave structure, we would expect price to break out of the marked area and develop a valid motive structure to the upside.
The first important area for this scenario is 1.20818, marked on the chart as Bullish Confirmation.
However, simply moving above this level is not enough for us.
If price breaks above this area and then develops a valid bullish structure, we can give greater weight to the possibility of further upside and the development of Five Waves Up.
Along this path, the 1.20, 1.24, and then approximately 1.26–1.27 areas can become important zones to monitor for price reaction.
The key point is that even if five waves develop to the upside, we still need to observe the correction that follows. The structure will help us determine the degree we are actually dealing with.
⬛ Scenario 2 — Bearish Case
The bearish scenario has not been removed from the chart yet.
If price fails to develop a valid bullish motive structure and instead turns lower again, the possibility of a deeper correction becomes more important.
In that case, a break of the Corrective Channel and the development of a valid bearish structure would become particularly important.
The 1.15833 area is also marked as an important level for monitoring the bearish scenario.
If this path continues, the structure could become more complex and deeper, potentially developing into a larger corrective pattern.
🌀 What Matters Most Right Now
At this stage, we do not want to force the market to follow either scenario.
Scenarios are the map; price structure must reveal the actual path.
If price breaks above the bullish area and develops a valid motive structure, the bullish scenario will gain more weight.
If the upward move fails to produce the required structure and the market returns to a bearish structure, the possibility of a deeper correction will become important again.
Finally, 1.01771 remains marked on the chart as an important Invalidation level.
For us, even a large bullish or bearish move by itself is not enough.
We are waiting for structure.
Structure First. Scenario Second.
Patterns whisper. I listen.
— Mr. Nobody
Euro / U.S. Dollar
2 days ago
EUR/USD — Larger Correction or the Continuation of the Bullish T
Euro / U.S. Dollar
Jun 20
EURUSD: Grand Supercycle Perspective & Structural Outlook
 Long
Long
 Long
Long
 Long
Long
 Long
Long